Visual-ICE™ Cryoablation System
3-9
To briey display the time associated with a completed cycle, press the section of the status bar for
the selected operation.
Press the Scale button to adjust the graphical display of the channel status such that all operations
are visible. Press the Scroll button to adjust the graphical display to 5-minute increments; the display
scrolls throughout the procedure.
Press the Maximize button (+) to enlarge the graphical display. Press the Minimize button (-) to
reduce the display to the original size.
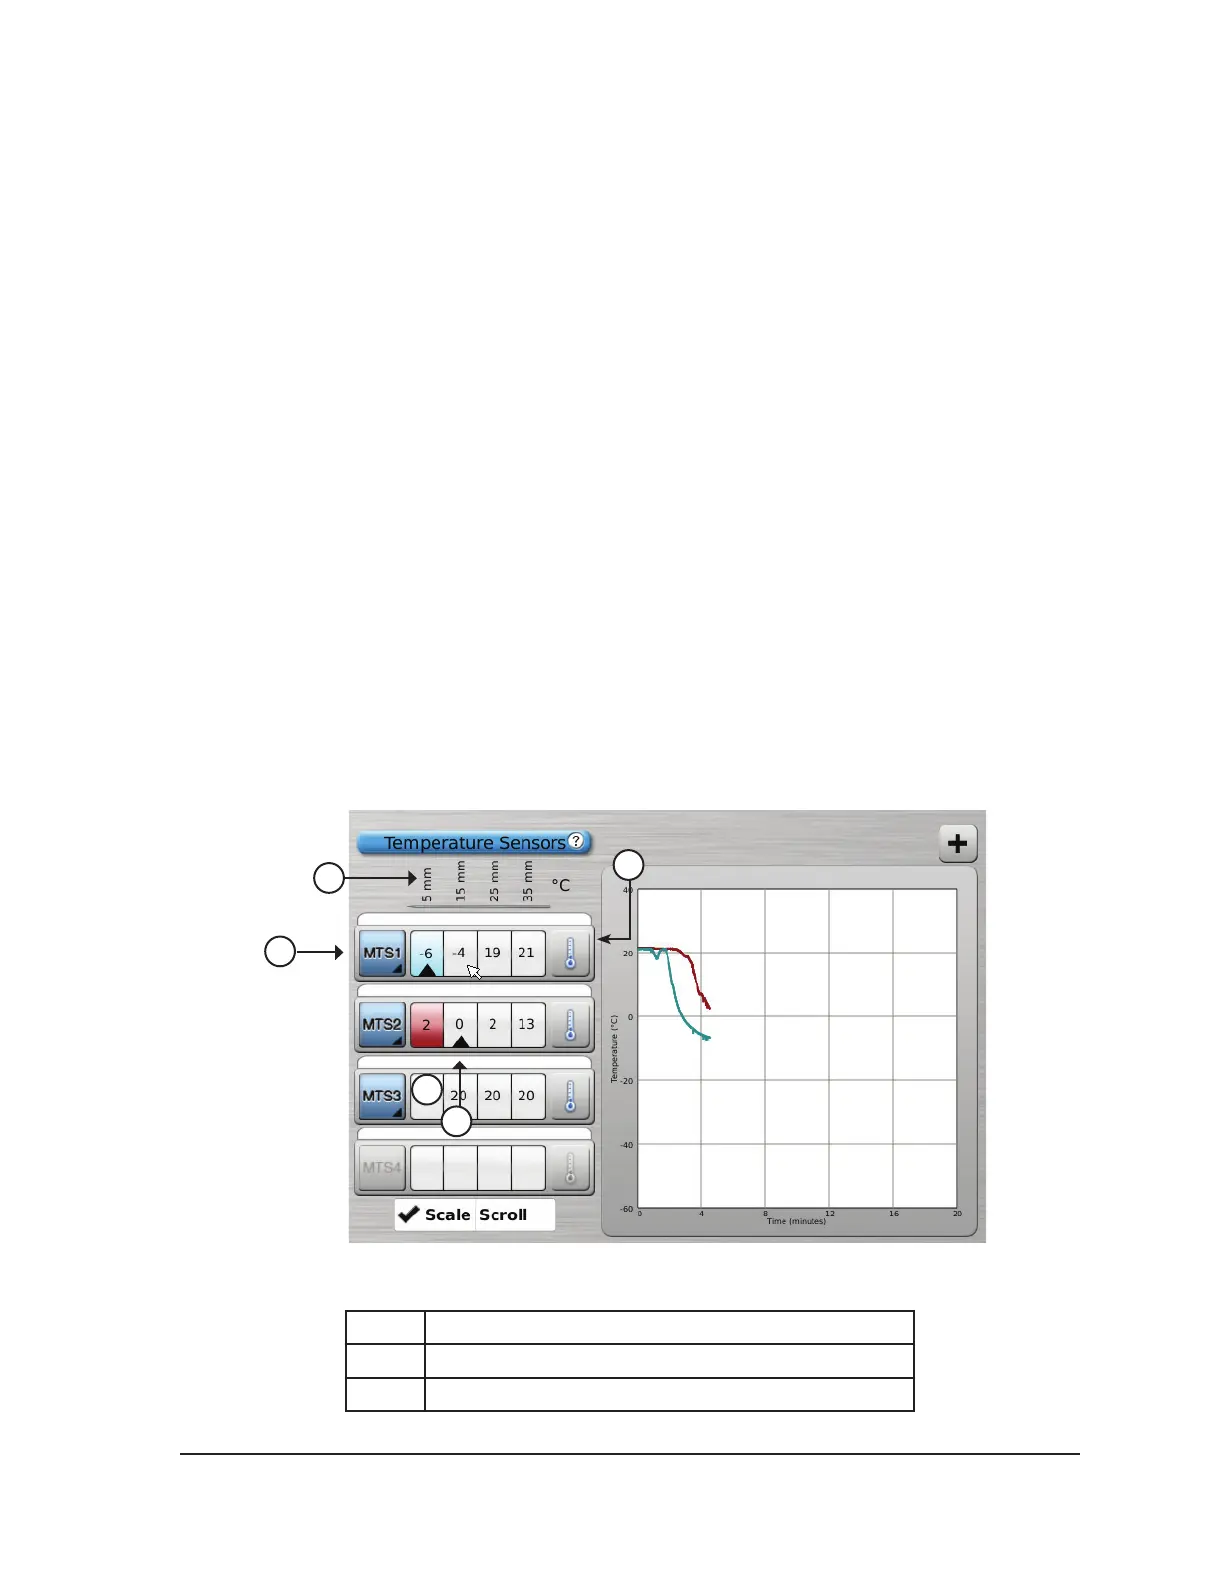
3.3.7 Temperature Sensors
The Temperature Sensors section (Screen 3-10) displays the temperature measured for each sensor
location on the connected MTS needles and a black triangle highlights the coldest temperature on
each MTS.
Temperature vs. Time can be plotted for any four selected sensor locations from the connected MTS
needles. Press the button corresponding to the selected sensor location on an MTS to select that
sensor location to be graphed. Press the respective MTS Channel button to graphically display all
four sensor locations of an individual MTS. The color of the selected temperature sensor location
corresponds to the color of the temperature line on the graph. Press the Thermometer button to
graph the coldest temperature on a selected MTS. Press the Thermometer button again to return to
the original display.
NOTE: A maximum of four sensor locations can be displayed on the graph at any one time. The four
selected sensor locations can be from any of the connected MTS needles.
1
3
2
5
6
Screen 3-10. Temperature Sensors section
1 MTS sensor locations
2 MTS Channel button
3 Thermometer button