3-10 User Manual
4 Maximize button
5 Button corresponding to 5 mm sensor location
6 Triangle indicates coldest sensor
Select the Scale button to adjust the graphical display of the temperature measurements such that
the temperature throughout the entire procedure is visible. Select the Scroll button to display a scroll
bar to scroll through the graphical data during the procedure.
To enlarge the Temperature Sensors graphical display press the Maximize button (+). Press the
Minimize button (-) to return the display to the original size.
Advanced Temperature Sensors Controls: Pressing and holding an MTS Channel button provides
an option to set visual alarms when a chosen temperature measurement falls below a desired value
or when the rate of temperature drop is greater than a desired value. This advanced control also
provides an option to label the MTS location (reference Section 4.8).
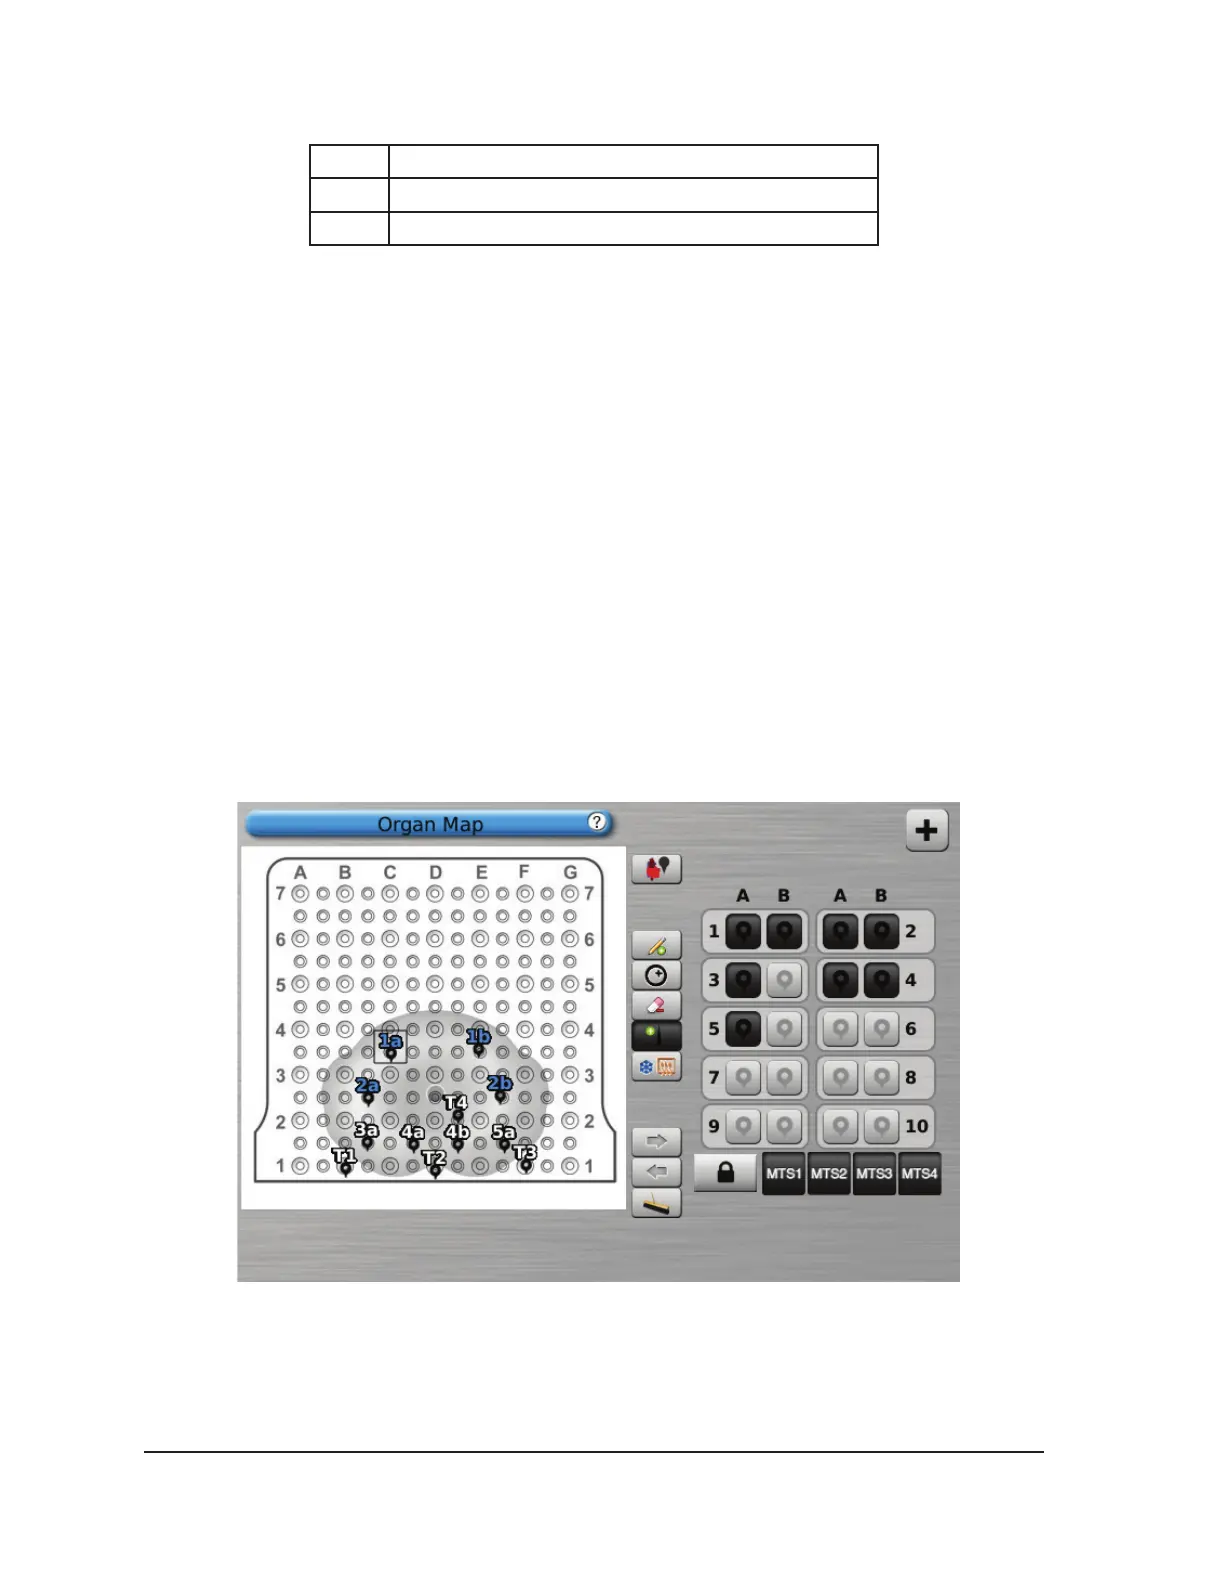
3.3.8 Organ Map
The Organ Map may be used to provide a pictorial representation of tumor location, needle placement
and cycle activity for a selected image (kidney, prostate, liver, or lung) or for a drawn image (other).
Tumor shapes may be drawn within the displayed organ, and needles placed, moved, or removed
within the organ map. A blank drawing canvas is available for customized display. Needles may be
controlled from the organ map by using the Control Needle button. Needle activity status (Freeze,
Thaw, or Idle) is represented by color coding.
Screen 3-11. Organ Map section