Scada
145
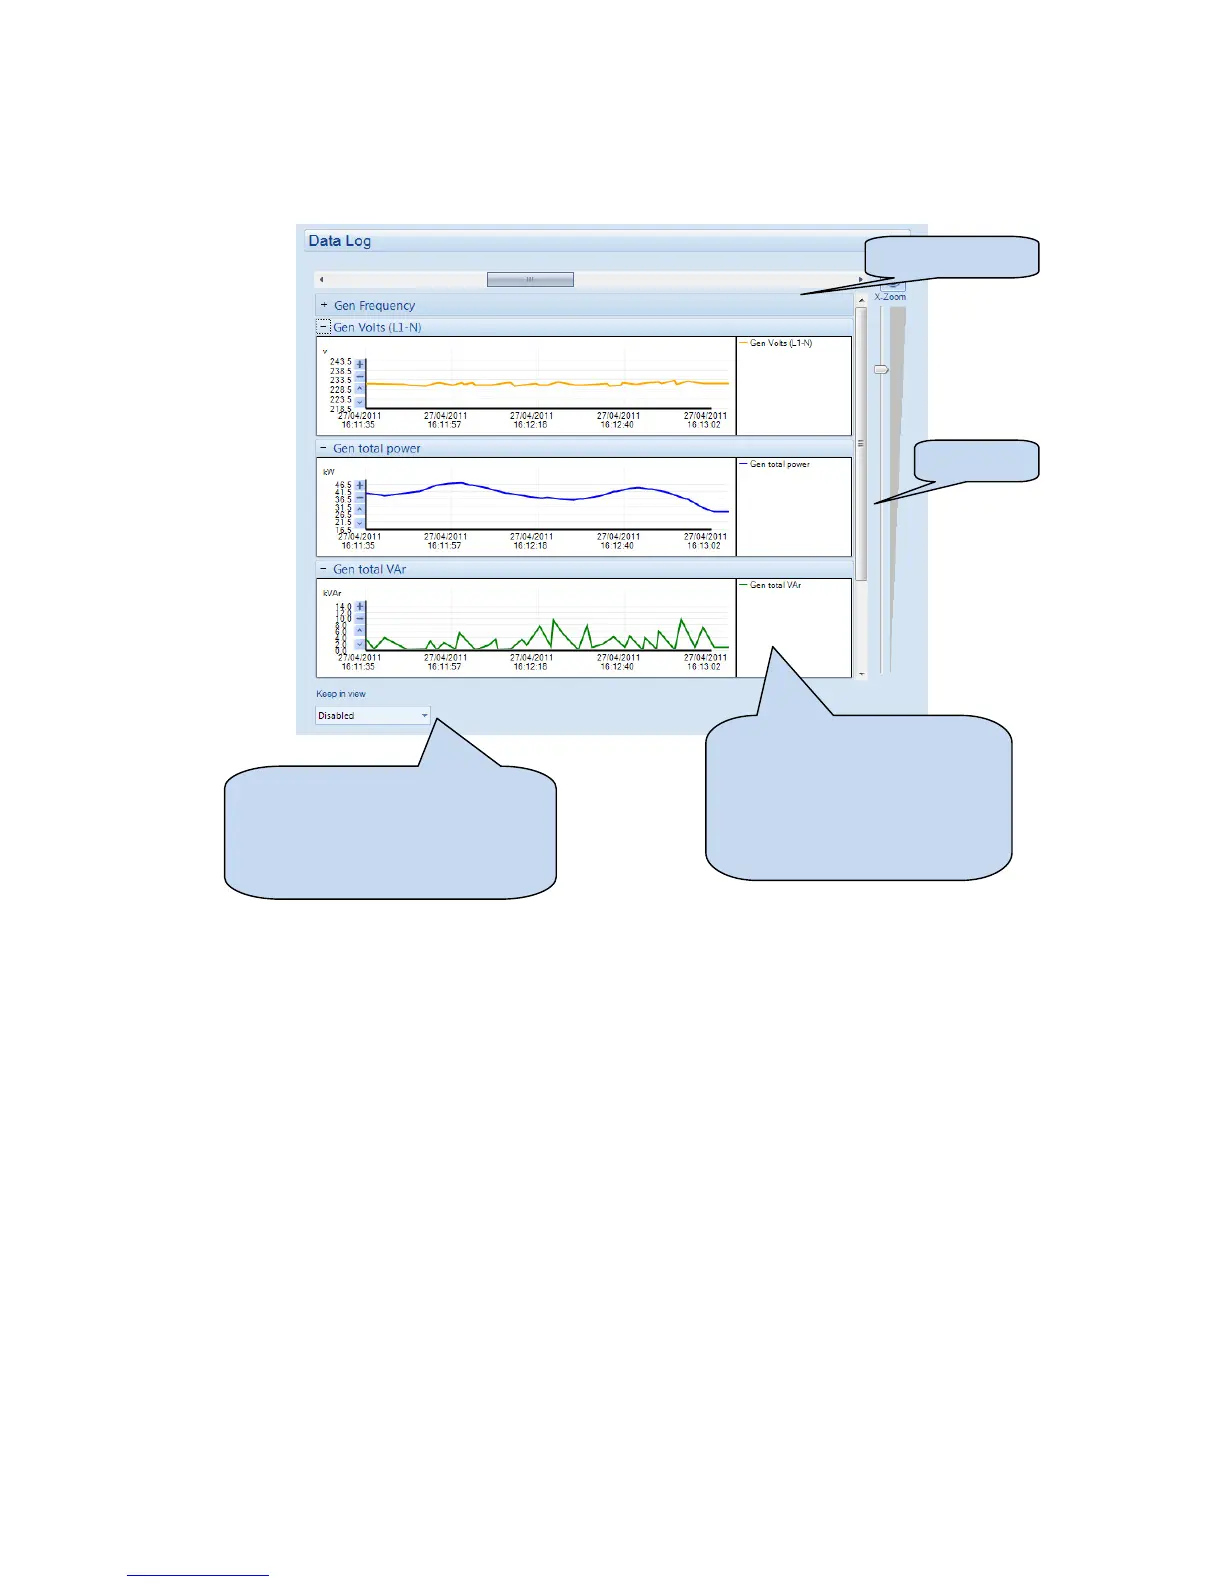
5.20 DATALOG
Allows viewing of the module datalog (if configured).
Selects the timescale of the
displayed graphs.
Scroll bars on the graphs ‘x’ axis can
also be used to scroll the graph
backwards and forwards in time.
The data is automatically collated
and presented in the graphs.
For example Voltages are
displayed in the same graph, but
not mixed with kW for example,
which are shown on a separate
graph.
Zoom slider
 Loading...