114 | SEVEN PLUS Continuous Glucose Monitoring System
Clarke Error Grid Analysis
The Clarke Error Grid was used to determine if SEVEN PLUS results are “clinically accurate.” The
Clarke Error Grid divides a correlation plot into 5 zones, which are described in the table below.
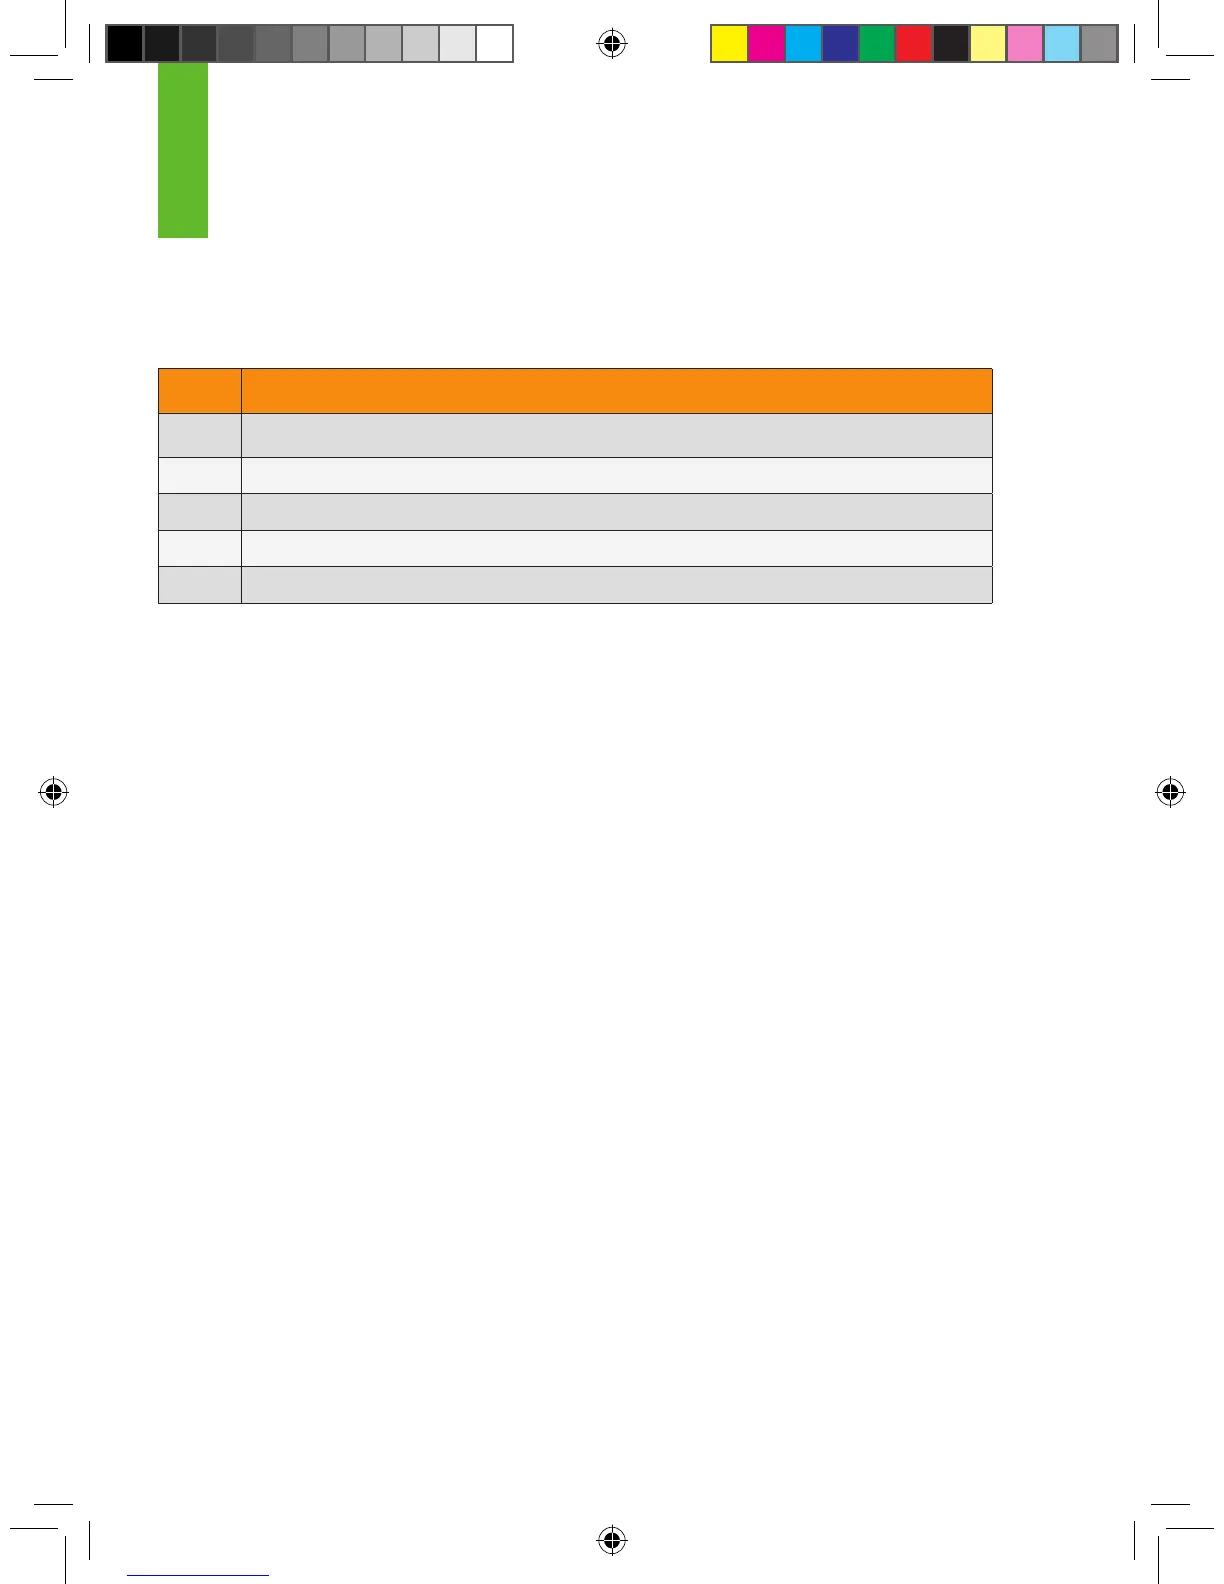
Zone Description
A Clinically Accurate, would lead to correct treatment decisions
B Would lead to benign decisions or no treatment
C Would lead to overcorrection of normal glucose levels
D Would lead to failure to be aware of and treatment of high or low glucose levels
E Would lead to inaccurate and “dangerous” treatment decisions
Results in zones A and B are considered “clinically acceptable”, in which you would most likely make accurate
treatment decisions or decide not to do treatment with the readings provided, while results in zones C, D, and E
can lead to dangerous treatment errors. The Clarke Error Grid zones are labeled on a correlation plot in Figure 1.
Each YSI result (on the horizontal axis) is matched up with its corresponding SEVEN PLUS result (on the vertical
axis). A point is recorded where the two readings intersect. These results are based on 1,827 paired data
points recorded.
10