SEVEN PLUS User’s Guide | 115
Figure 1.
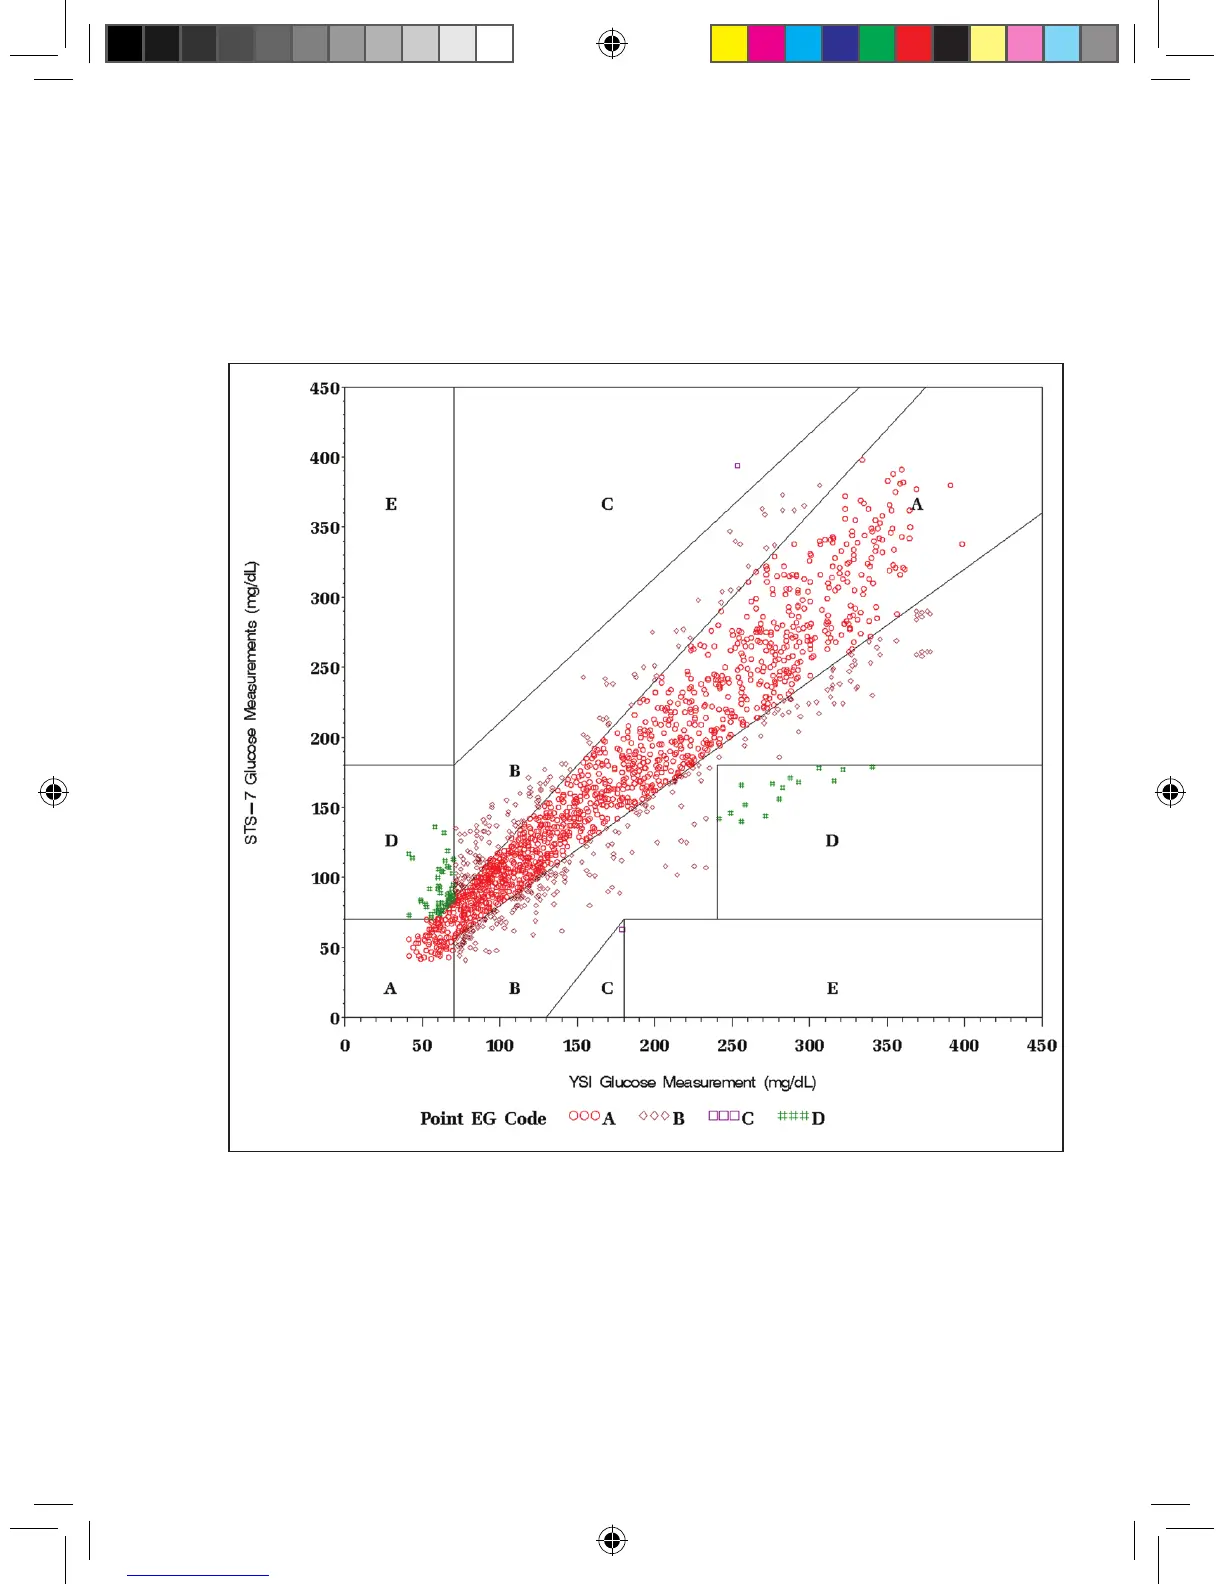
Clarke Error Grid, SEVEN PLUS Results Compared to YSI Results
Point Error Grid Regions for All Site
The percentage of SEVEN PLUS results in the above graph are presented in Table 6 on the next page according
to the percentage of points falling within each zone (A-E). Results are further broken down (stratied) according to
therange of glucose concentration.