116 | SEVEN PLUS Continuous Glucose Monitoring System
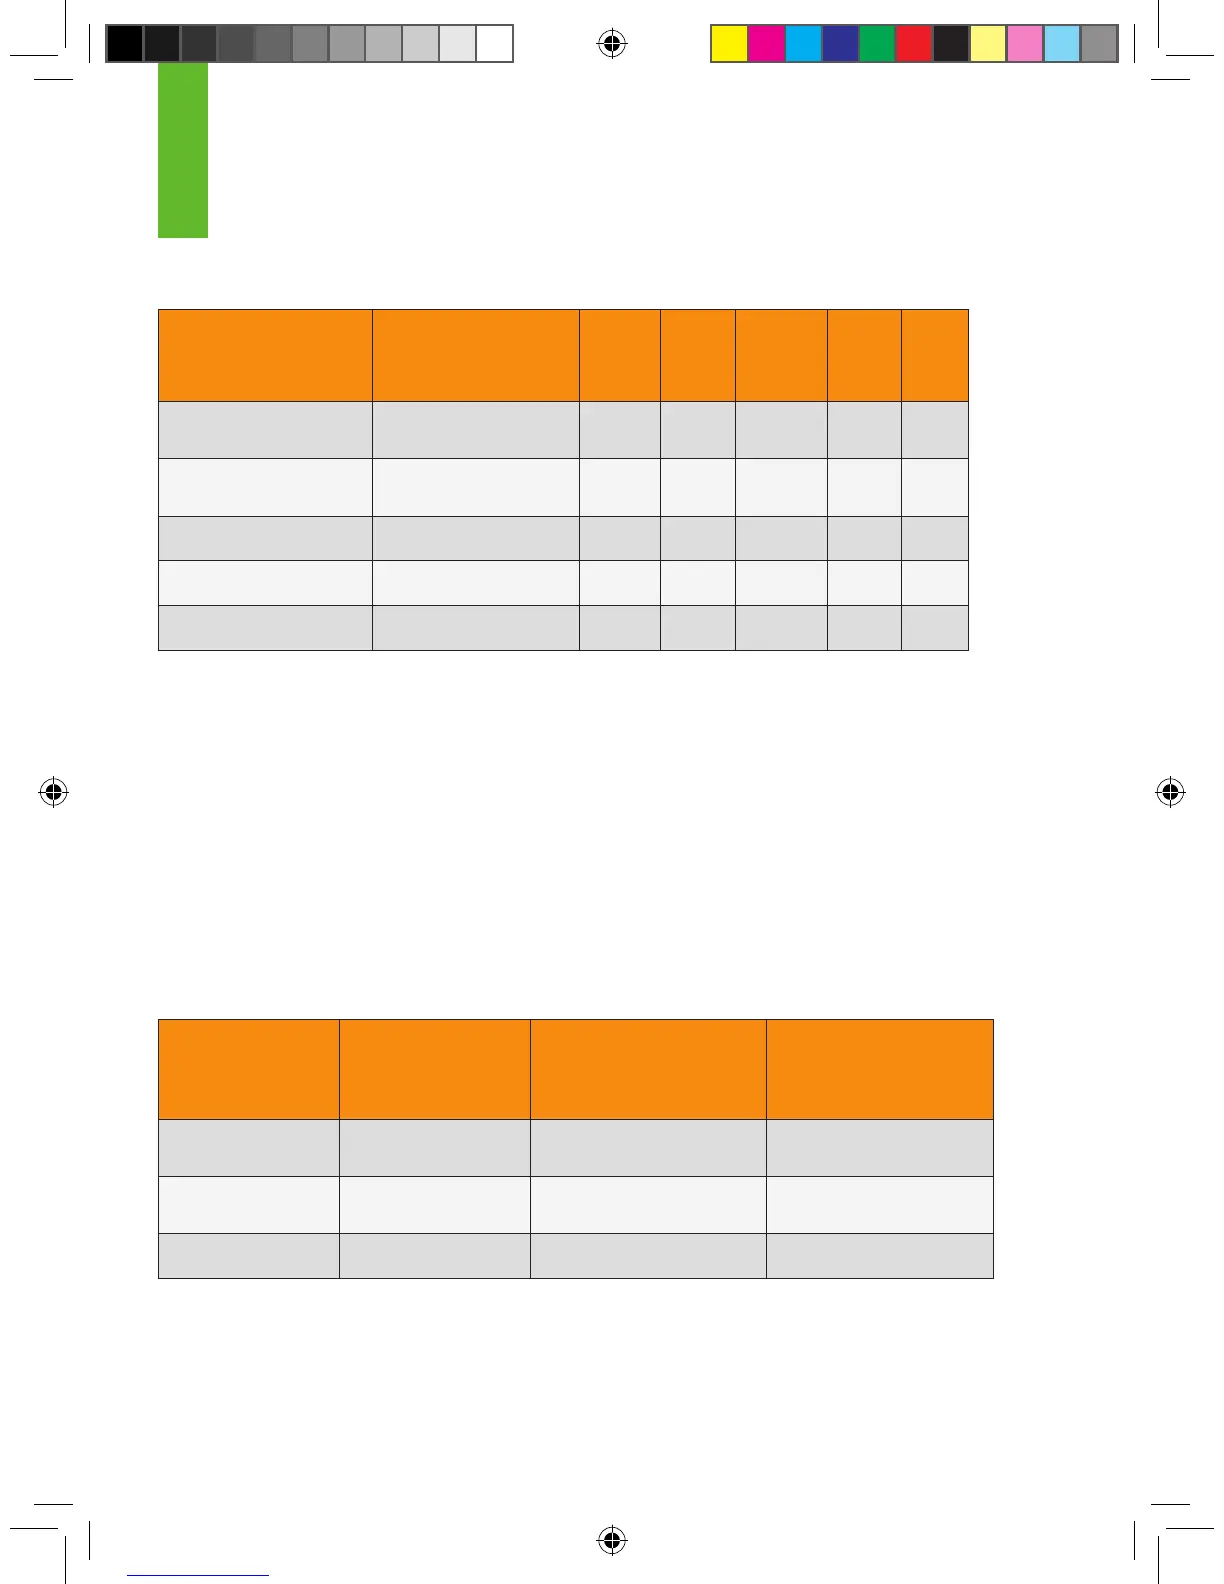
Table 6. Clarke Error Grid Analysis, Stratied by YSI Glucose Concentrations
Glucose Range
(mg/dl)
Total YSI –
SEVEN PLUS
Pairs
A
%
B
%
C
%
D
%
E
%
40-400 1,827 73% 23% 0% 4% 0%
40-80 277 57% 22% 0% 21% 0%
81-180 801 73% 27% 0% N/A* N/A*
181-300 563 81% 17% 0% 2% 0%
301-400 186 75% 23% N/A* 2% 0%
* N/A means that the Clarke Error Grid does not consider the possibility of these zones in that glucose range.
The Continuous Error Grid was also used to determine if the SEVEN PLUS results
are “clinically acceptable.” The Continuous Error Grid looks at how closely
the SEVEN PLUS readings match to the YSI Analyzer and also how closely the
SEVEN PLUS glucose rate of change (how fast the glucose rises or falls) compares
to the actual blood glucose rate of change measured by the YSI. The data is
evaluated in 3 zones: clinically accurate readings, benign errors, and clinically
inaccurate readings. See the table below for the SEVEN PLUS accuracy by
glucose range. There were 1,827 paired points evaluated.
Table 7. Continuous Error Grid Combined Point and Rate Rating Table
Hypoglycemia
(YSI<= 70 mg/dl)
(8% of the data)
Euglycemia
(70< YSI <=180 mg/dl)
(51% of the data)
Hyperglycemia
(YSI >180 mg/dl)
(41% of the data)
Accurate Readings 61% 97% 94%
Benign Errors 1% 2% 2%
Inaccurate Readings 39% 1% 5%
10