Patient Monitor User Manual Trend and Event
- 77 -
Chapter 10 Trend and Event
The monitor provides 96-hour trend data of all parameters, storage of 500 NIBP measurement
results and 60 alarm events. This chapter gives detailed instruction for review of all data.
10.1 Trend Graph
The latest 1-hour trend is displayed every 1 or 5 seconds;
The latest 96-hour trend is displayed every 1, 5 or 10 minutes;
Pick
TREND GRAPH
in the
SYSTEM MENU
to call up the following menu:
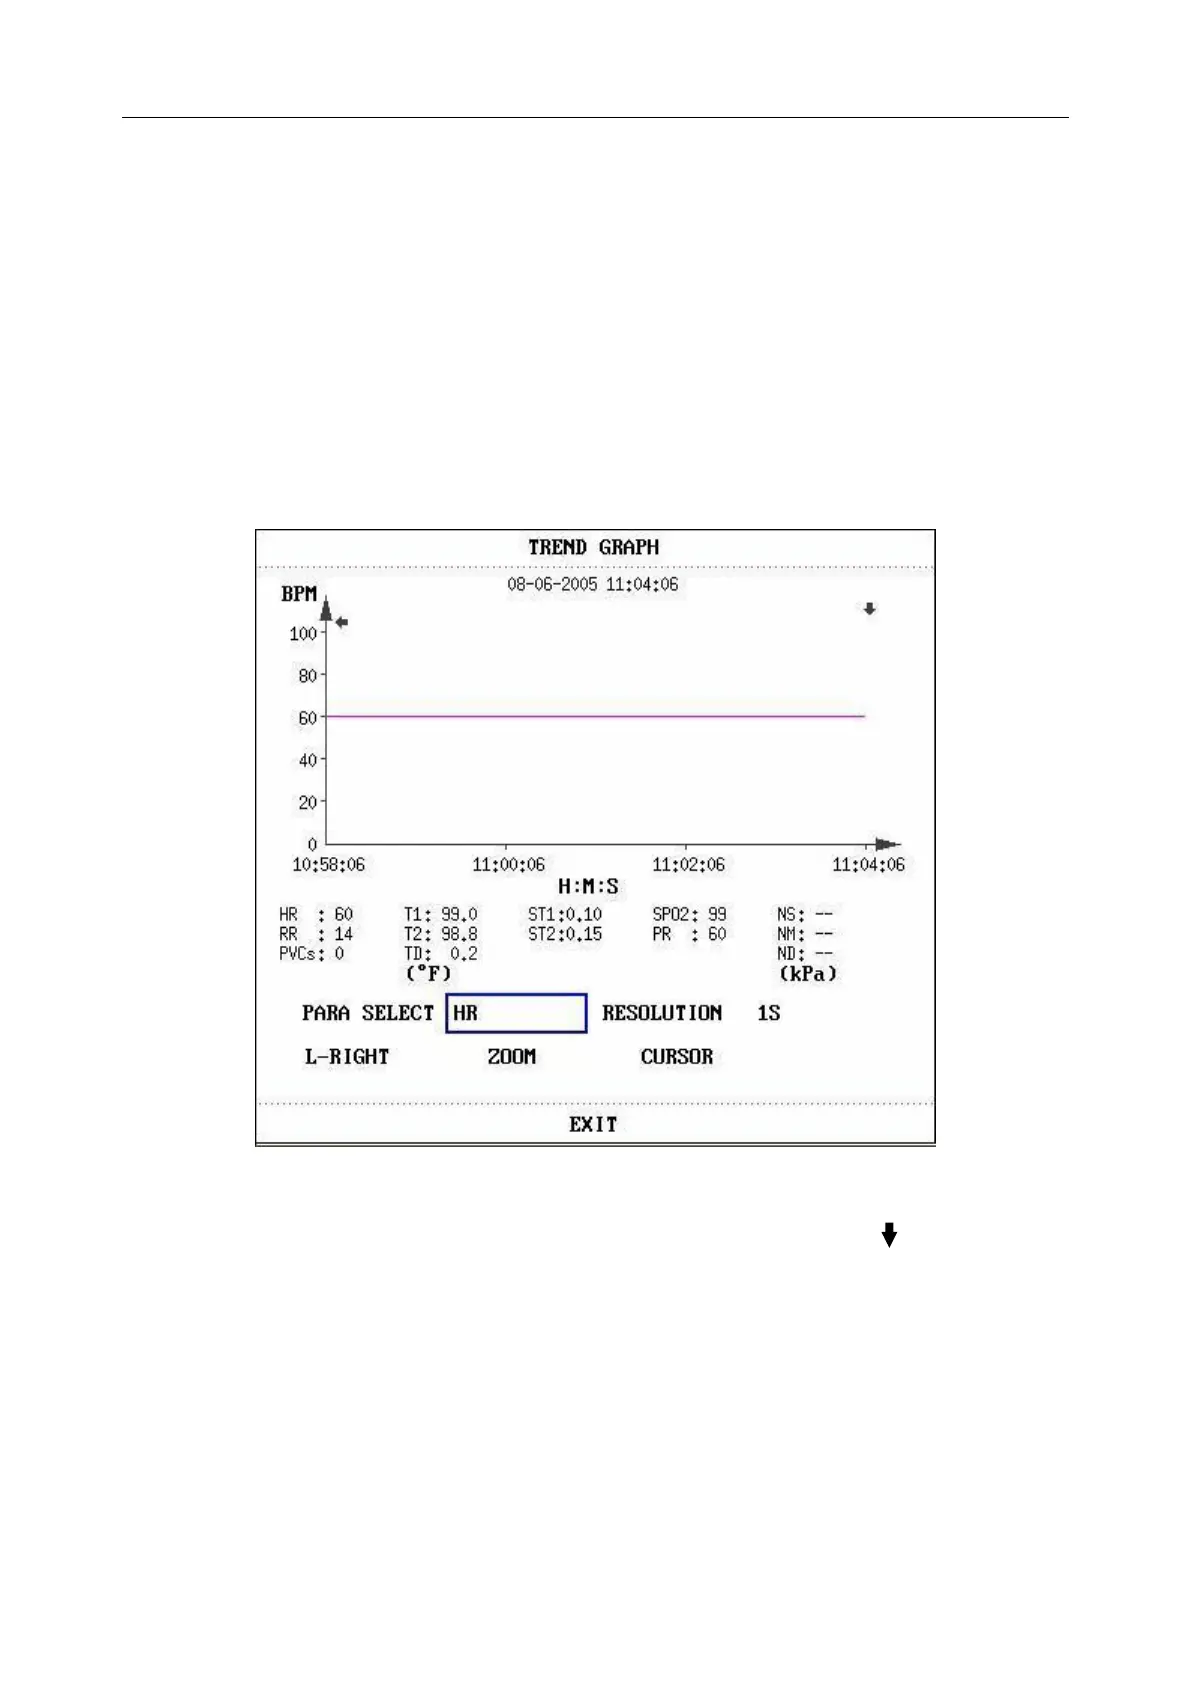
Figure 10-1 Trend Graph Menu
In the trend graph, the y-axis stands for the measured value and x-axis time. " " is the cursor of
the trend graph, the parameter value of the position pointed by the cursor is displayed below the
trend graph and the corresponding time is displayed above the trend graph. Other trends except
NIBP trend are displayed as continuous curves. In NIBP trend graph, "
▼
" indicates systolic
value, "
▲
" indicates diastolic value, and "*" indicates mean value.
To select trend graph of a specific parameter
Pick PARA SELECT item and select a requested parameter name by turning the knob.
 Loading...