Chapter 8: Physiology and Physio
Relationship Monitoring Screens
he Physiology Screen and the Physio Relationship
monitoring screens provide a graphic display of
monitored parameters and their relationship to each
other.
The volumetric parameters and lungs appear grey as they
are not available when using the noninvasive ClearSight
technology. These parameters are available when using
VolumeView technology.
Physiology Screen
The Physiology screen is an animation depicting the
interaction between the heart, lungs, blood, and vascular
system. Continuous parameter values are displayed in
association with the animation.When pulse rate and CO are
available the heart beats and the blood flows in an animated
representation.
1 The curved line indicates the SVV slope. The lantern
moves up and down the line according to the SVV value.
The color of the lantern changes based upon set target
ranges.
2 Cardiac Output is indicated on the arterial side of the
vascular system animation.
3 Systemic Vascular Resistance, indicated in the center of
the vascular system animation, is available with manual
input of CVP with continuous calculation as SVR =
[(MAP-CVP)/CO]*80.
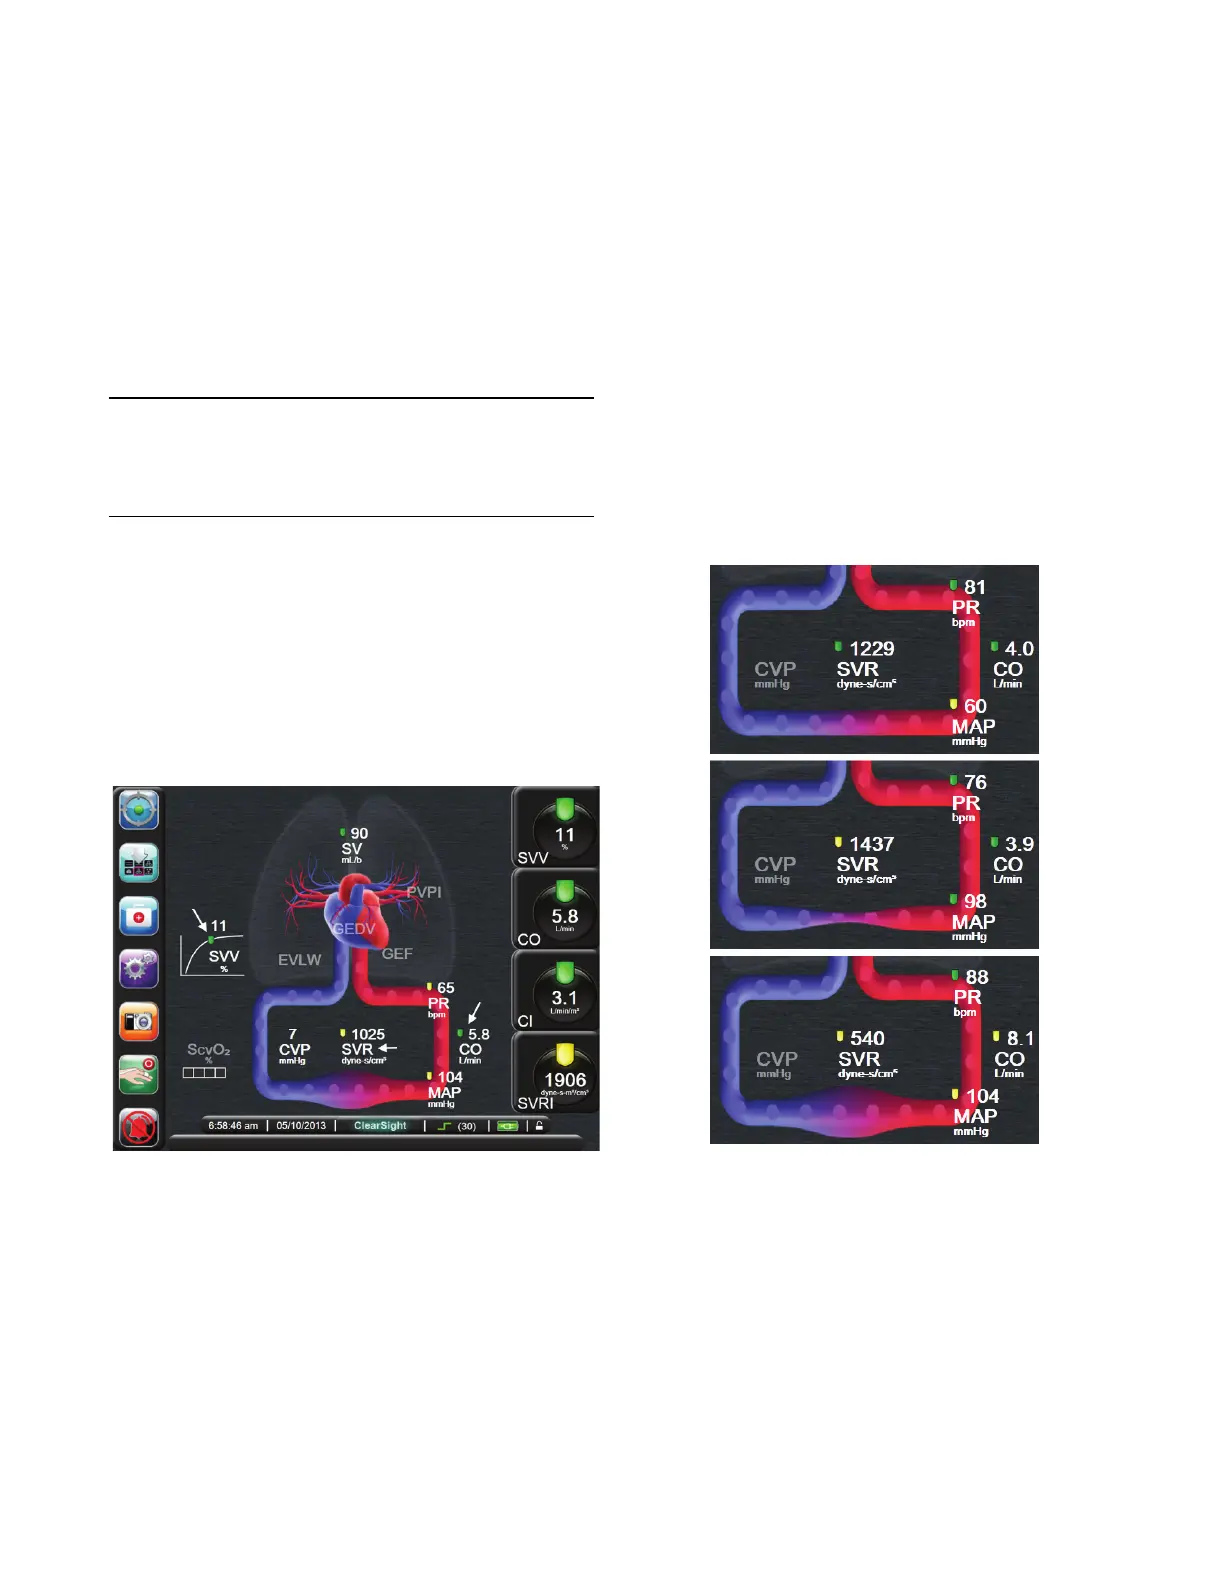
In Figure 8-2 , the vessels are shown with differing levels of
constriction. The first shows normal resistance, the second
shows high SVR (resistance), and the third shows low SVR
(resistance). When no CVP value has been entered and SVR
is unavailable, the visual representation of the vessel will
default to the visual representation of normal resistance.
The clinical target indicators are displayed with available
parameters. SVV also displays the SVV Slope indicator.
The heart beats at a similar rate as the pulse rate. To depict
Cardiac Output the blood flow is animated at three rates:
• Slow when CO is less than the low target setting.
• Medium when CO is within the target setting.
• High when CO is above the high target setting.
Figure 8-1 Physiology Screen
Figure 8-2 Systemic Vascular Resistance