8-2
Physiology and Physio Relationship Monitoring Screens
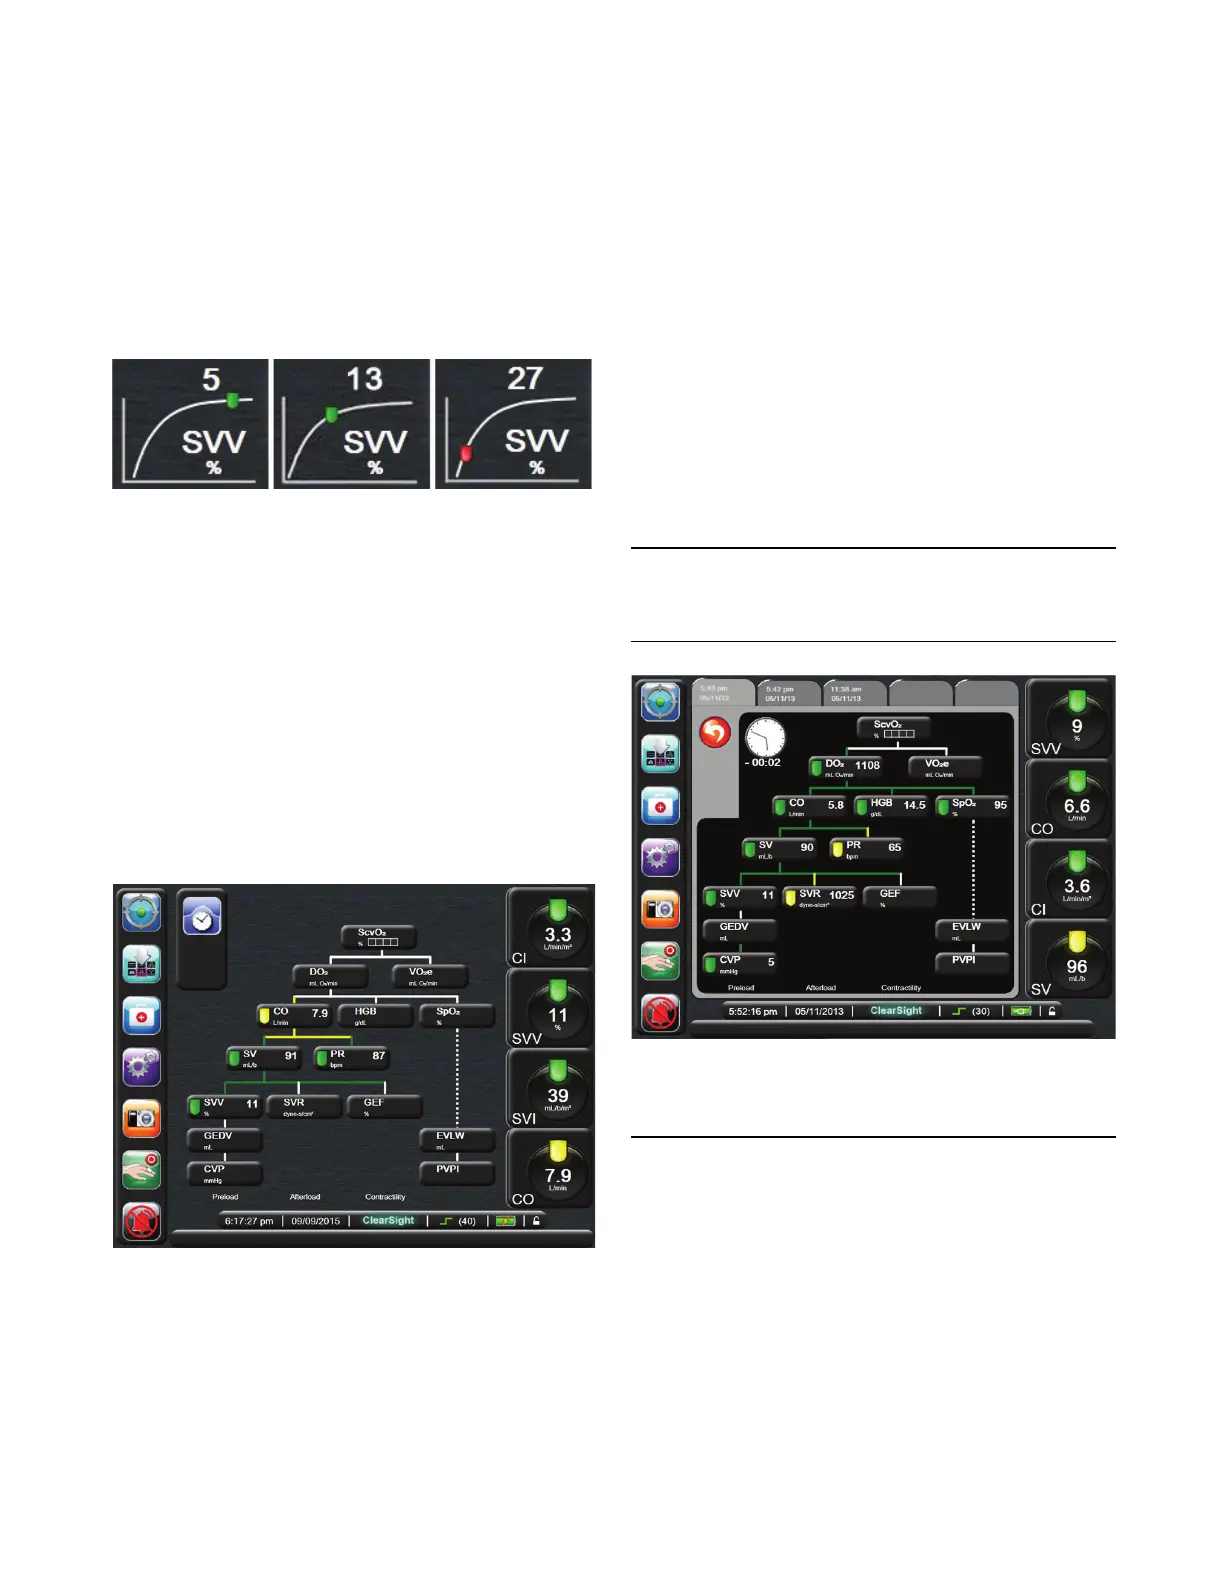
SVV Slope Indicator
The SVV Slope Indicator is a visual representation of the
Frank-Starling curve used when assessing the Stroke Volume
Variation value. The indicator displays the current SVV value
and lantern which changes based upon set target ranges. An
SVV value of 13% is displayed at approximately the
inflection point of the curve, as shown in Figure 8-3 . The
indicator is displayed on the Physiology and Historic
Physiology screens.
The user has the ability to enable or disable the display of the
SVV Slope Indicator from the Monitor Screens Settings
Menu. The default setting is enabled. When the SVV filtering
exceeded indicator is on, the system will not show the SVV
lantern on the SVV indicator curve.
Physio Relationship Screen
The Physio Relationship screen displays measured
parameters with connecting lines highlighting the
relationship of the parameters to each other. It automatically
updates as parameter values change to display current values.
Continuous and Historical Modes
The Physio Relationship screen has two modes: continuous
and historical. When in continuous mode, derived values are
always displayed as unavailable.
1 The vertical lines above the parameters appear in the same
color as the parameter lantern.
2 The vertical lines below the parameter appear in the same
color as the parameter lantern, except for the line below
SVV, which is the same as the parameter above it.
3 The horizontal lines are the same color as the line above
them.
4 The left bar appears after an historic physio record has
been created. To create an historic physio record, touch
the HGB, SpO
2
or SvO
2
/ScvO
2
parameter button and
enter a value using the number pad.
5 The new physio record is filled with current continuous
parameter data, the entered value and any derived
calculated values (See “Physio Relationship Alarms/
Targets and Historical Data Screens” on page 8-3).
Before any values are entered for HGB, SpO
2
or SvO
2
/
ScvO
2
the clock/waveform icon does not appear. Only the
available continuous parameters are displayed.
The Historic Physio Relationship screen displays most of
the parameters available on the system at a point in time.
The screen displays lines connecting the parameters,
highlighting the relationship of the parameters to each
other. The Historic Physio Relationship screen displays the
configured (1-4) Key Parameters on the right hand side of
the screen. There is a horizontal tab composite at the top
that allows the user to navigate through the database of
historic records. The record times correspond to derived
value calculations.
Figure 8-3 SVV Slope Indicator
Figure 8-4 Physio Relationship Screen
Figure 8-5 Physio Relationship Historical
Data Screen