10327203;3
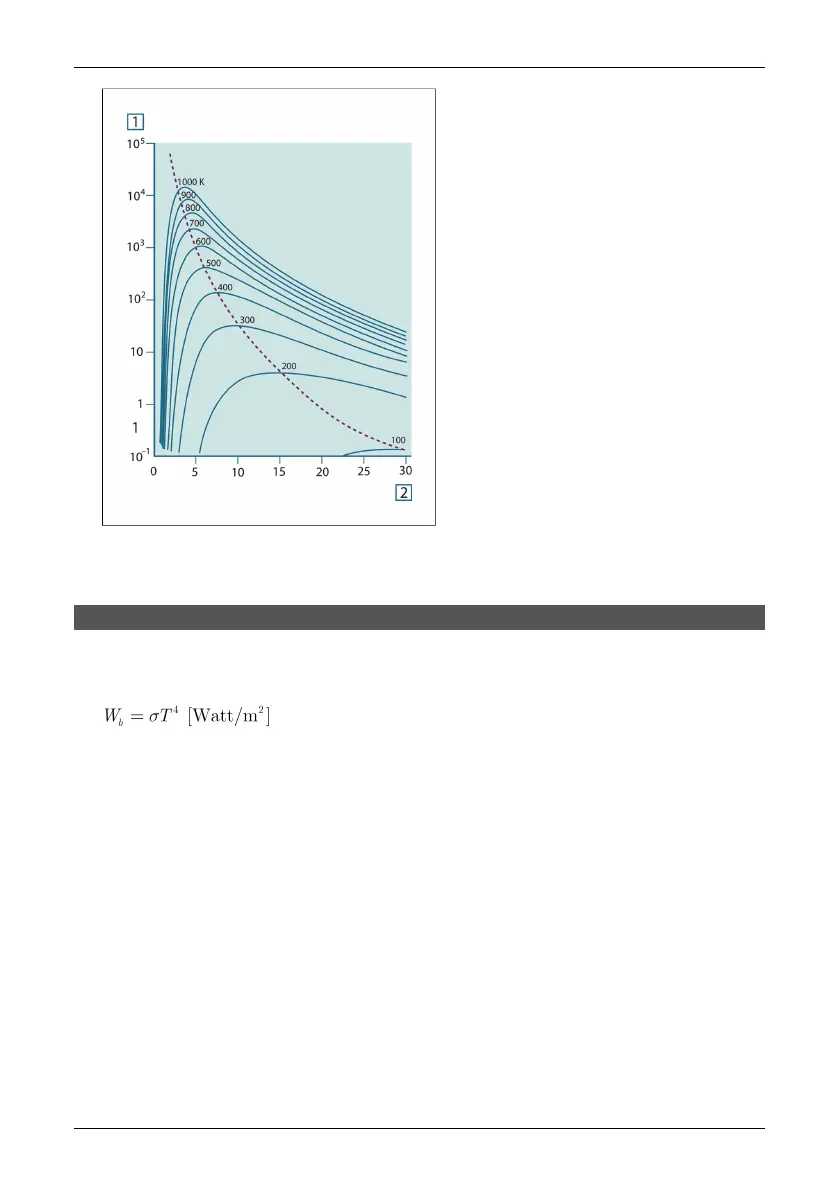
Figure 18.6 Planckian curves plotted on semi-log scales from 100 K to 1000 K. The dotted line repre-
sents the locus of maximum radiant emittance at each temperature as described by Wien's displacement
law. 1: Spectral radiant emittance (W/cm
2
(μm)); 2: Wavelength (μm).
18.3.3 Stefan-Boltzmann's law
By integrating Planck’s formula from λ = 0 to λ = ∞, we obtain the total radiant
emittance (W
b
) of a blackbody:
This is the Stefan-Boltzmann formula (after Josef Stefan, 1835–1893, and Ludwig
Boltzmann, 1844–1906), which states that the total emissive power of a blackbody
is proportional to the fourth power of its absolute temperature. Graphically, W
b
represents the area below the Planck curve for a particular temperature. It can be
shown that the radiant emittance in the interval λ = 0 to λ
max
is only 25 % of the
total, which represents about the amount of the sun’s radiation which lies inside
the visible light spectrum.
92 Publ. No. 1 557 536 Rev. a35 – ENGLISH (EN) – January 20, 2004
18.3 – Blackbody radiation

 Loading...