Scope/Meter Mode
Changing the Graphic Representation on the Screen
2
2-13
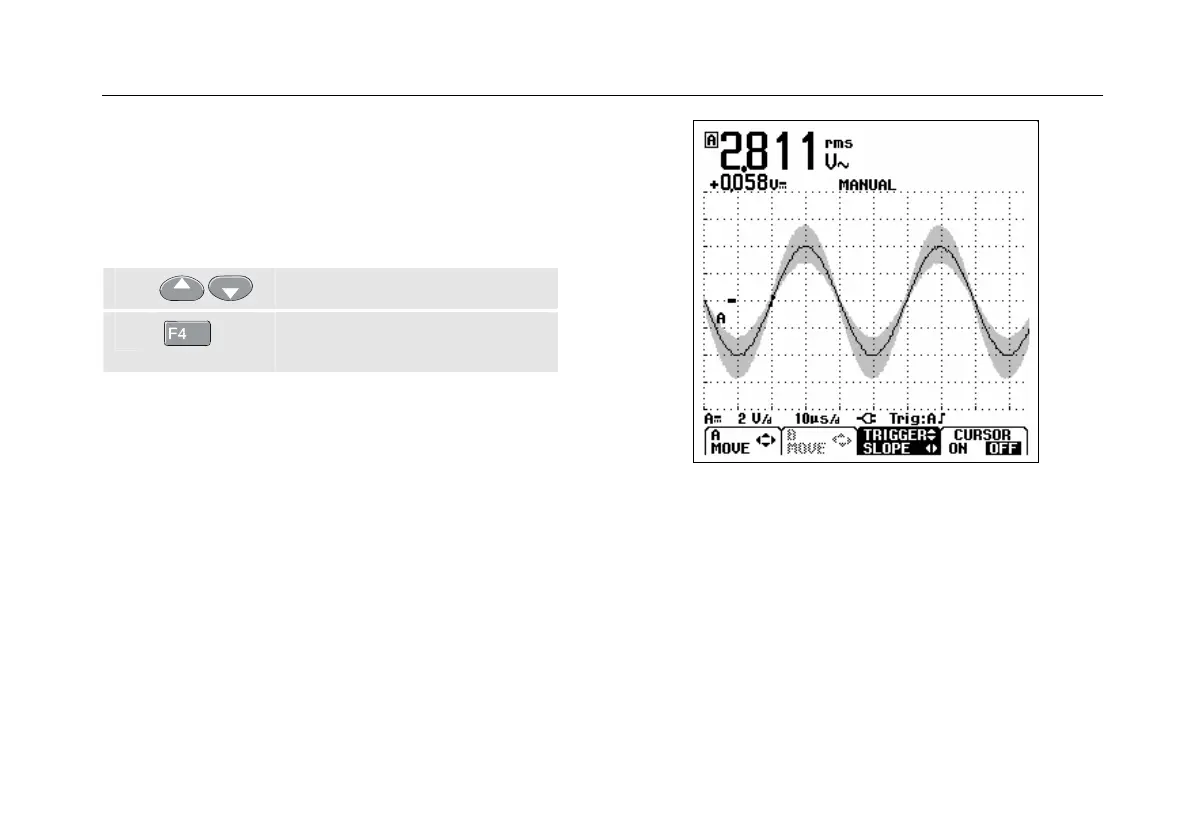
Displaying the Envelope of a Waveform
The test tool records the envelope (minimum and
maximum) of the live waveforms A and B.
Repeat the first two actions of ‘Smoothing the Waveform’,
and then do the following:
e
Highlight ENVELOPE.
f
(
3x)
Start monitoring the envelope of
the waveform.
The screen shows the resultant envelope in a gray
waveform. See Figure 2-12.
You can use ENVELOPE to observe variations in time or
amplitude of input waveforms over a longer period of time.
Figure 2-12. Displaying the Envelope of a Waveform