DTX Series CableAnalyzer
Technical Reference Handbook
3-22
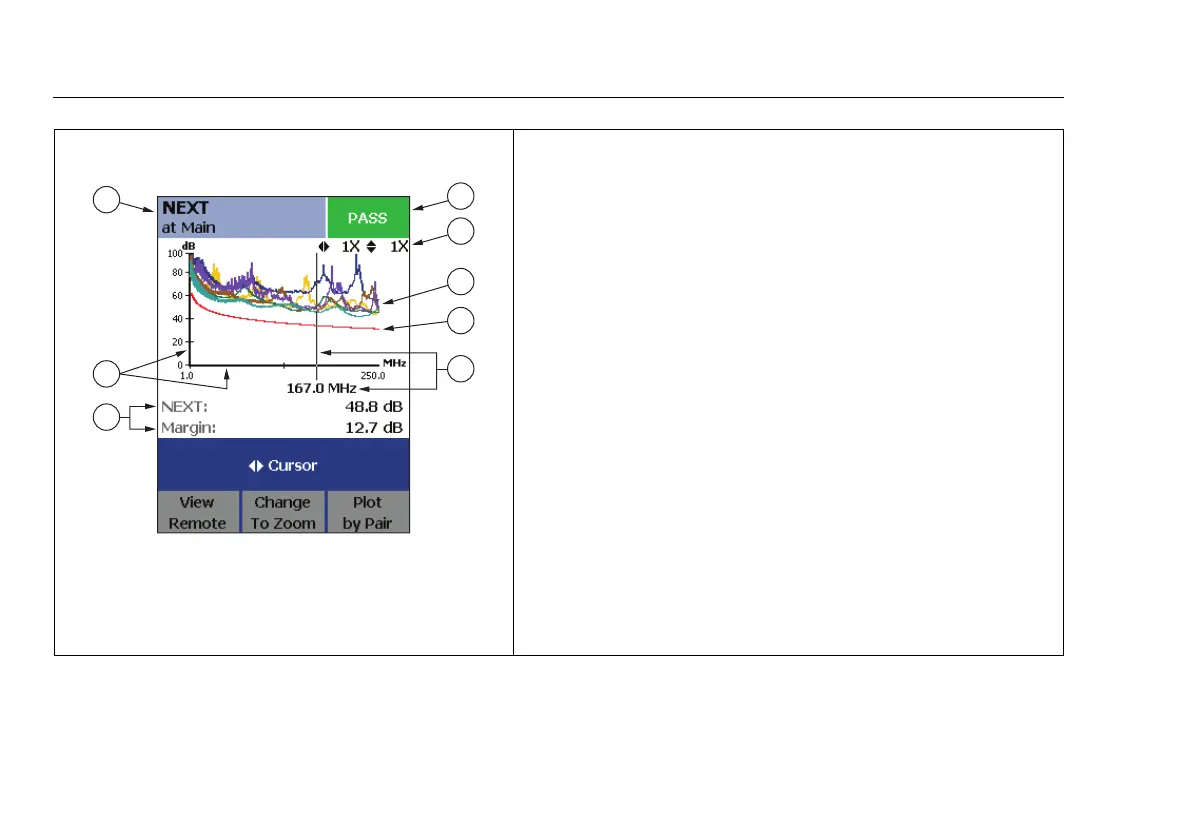
Figure 3-15. NEXT Plot
amd07f.eps
A
The location of the NEXT results. Press J to switch between
the tester and smart remote.
B
The overall NEXT result. “PASS*/FAIL* Results” on page 3-12
describes results marked with an asterisk.
C
Horizontal and vertical magnification levels for the plot. To
change the magnification, press
KChange To Zoom; then
use
BC or AD to zoom horizontally or vertically.
D
Measured NEXT for the cable pairs. Higher NEXT means better
cabling performance.
E
The limit line (in red) for NEXT. The higher the measurements
rise above the limit line, the better the cabling performance.
Press L to see plots of individual pairs.
F
The cursor and its location on the frequency scale. When you
first view the plot, the cursor is placed at the worst margin. Use
BC to move the cursor (if the plot is in zoom mode, press
KChange To Cursor first).
G
The measured NEXT and margin at the cursor’s position.
Margin is the difference between the measured value and the
limit. Margin is negative if the pair failed.
H
The horizontal scale is the frequency range in megahertz. The
vertical scale is the NEXT range in decibels.
1
2
3
4
5
6
7
8
 Loading...