Diagnosing Copper Cabling Faults
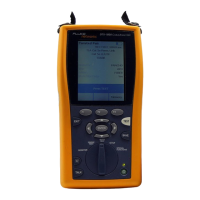
The HDTDR Analyzer
6-13
6
Figure 6-3. HDTDR Plot (permanent link adapters used)
amd97f.eps
A
The percentage of the HDTDR test signal reflected back to
the tester. See Figure 6-4. Reflections plotted are adjusted to
compensate for insertion loss. This means the plot
represents the magnitudes of signals at the reflection
source.
B
The beginning and end of the cabling under test. For a
permanent link, the plot shows some of the permanent link
adapter cable before and after the cabling under test.
C
Magnification level for the plot. Use AD to
zoom in or out at the cursor’s location.
D
The distance to the end of the cabling.
E
The cursor and the distance to the cursor from the
tester. Use
BC to move the cursor.
F
The reflection percentage at the cursor's location.
G
Shows the reflection plots by pair. Press I to return
to the plot of all pairs.
H
Toggles the vertical magnification between 1X and
4X.
I
Sets or clears the measurement marker. See J.
J
The distance between the measurement cursors.
To use the measurement cursors:
1 Press
J Clear Mark if necessary; then use BC
to move the cursor to the beginning of an area of
interest. Use
AD to zoom in on the
area if desired.
2 Press
J Set Mark; then use BCto move the
second cursor to the end of the area of interest.
1
3
4
5
10
2
6
8
7
9

 Loading...