Revision C CASE 6-23
2060290-201
During the Test
Trends Window
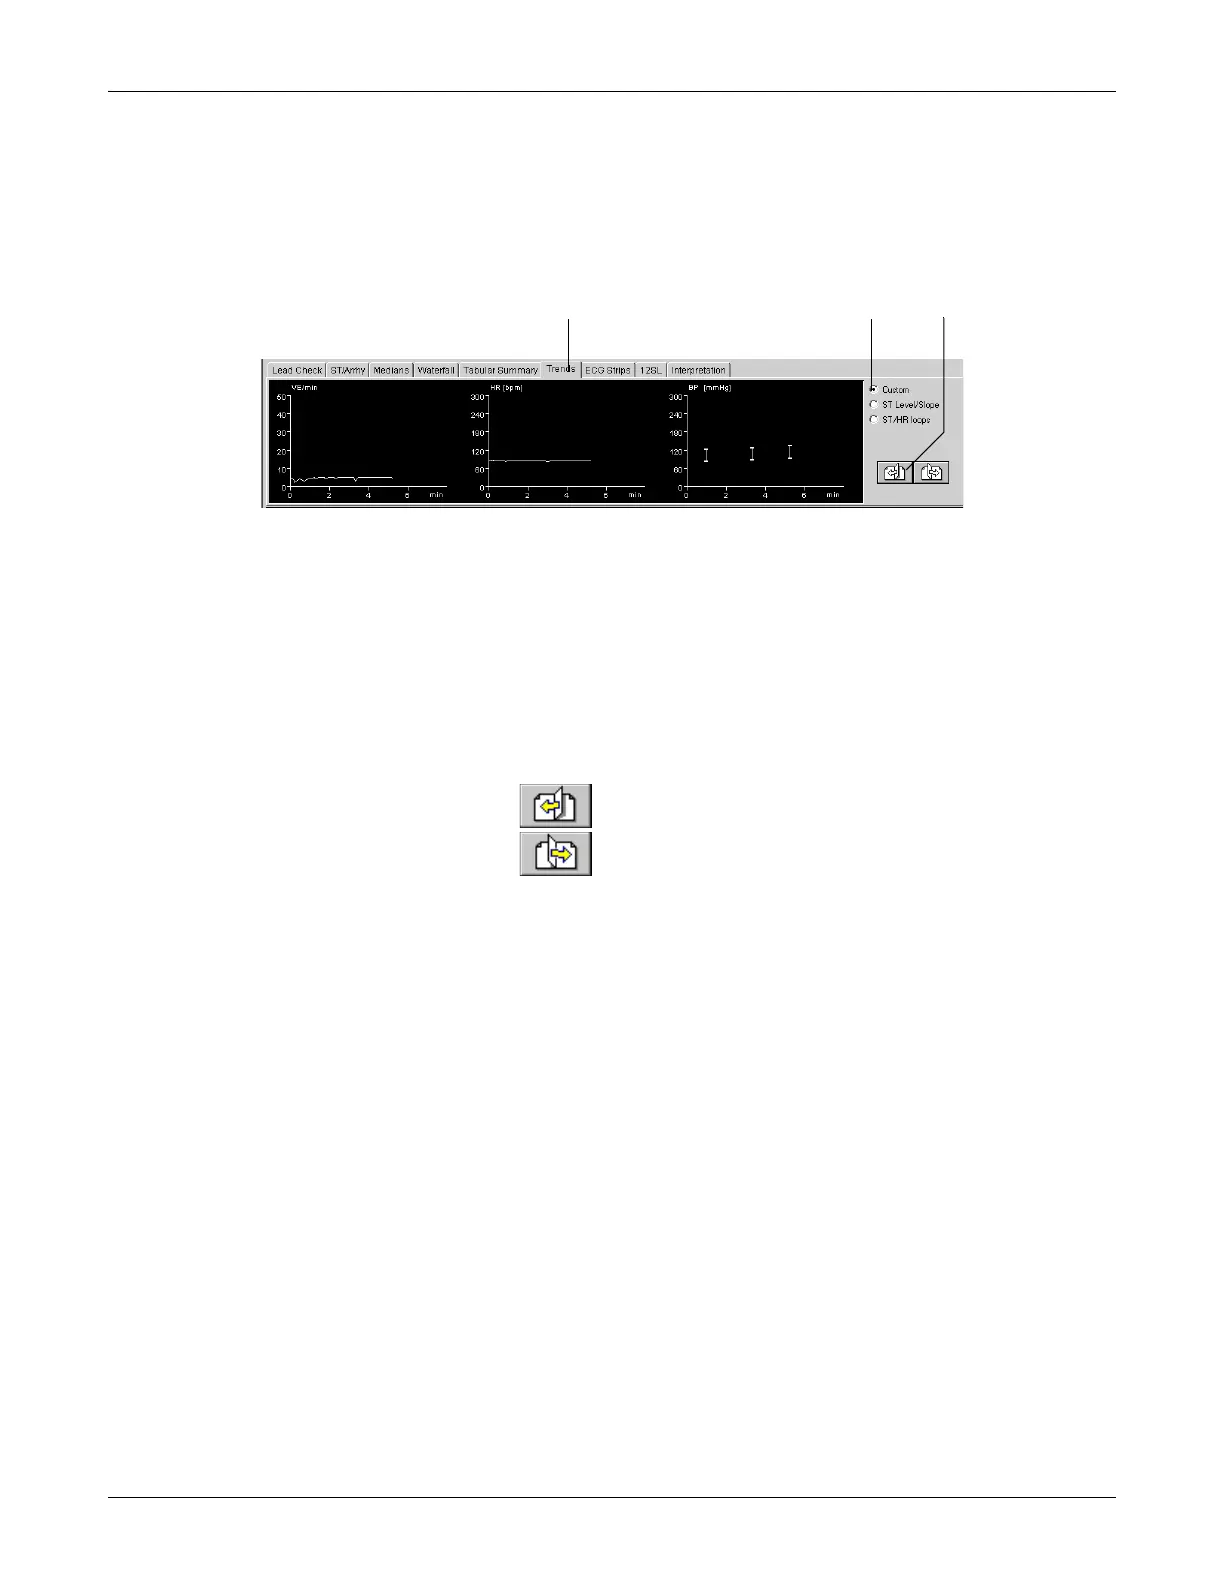
The Trends window displays graphic trends of different parameters. The
trends are updated in 30 second intervals.
A Click the tab to display the Trends window.
B Click an option button to display other trend formats.
Click Custom to display user configured trends.
Click ST Level/Slope to display the trend of ST level and slope versus time.
Click ST/HR Loops to display the 2-dimensional representation of ST level versus
HR (see section “Configuring Trends” on page 12-15).
C Click to display other trend displays
backward
forward