7-16 CASE Revision C
2060290-201
Post Test Review
Statistics Summary
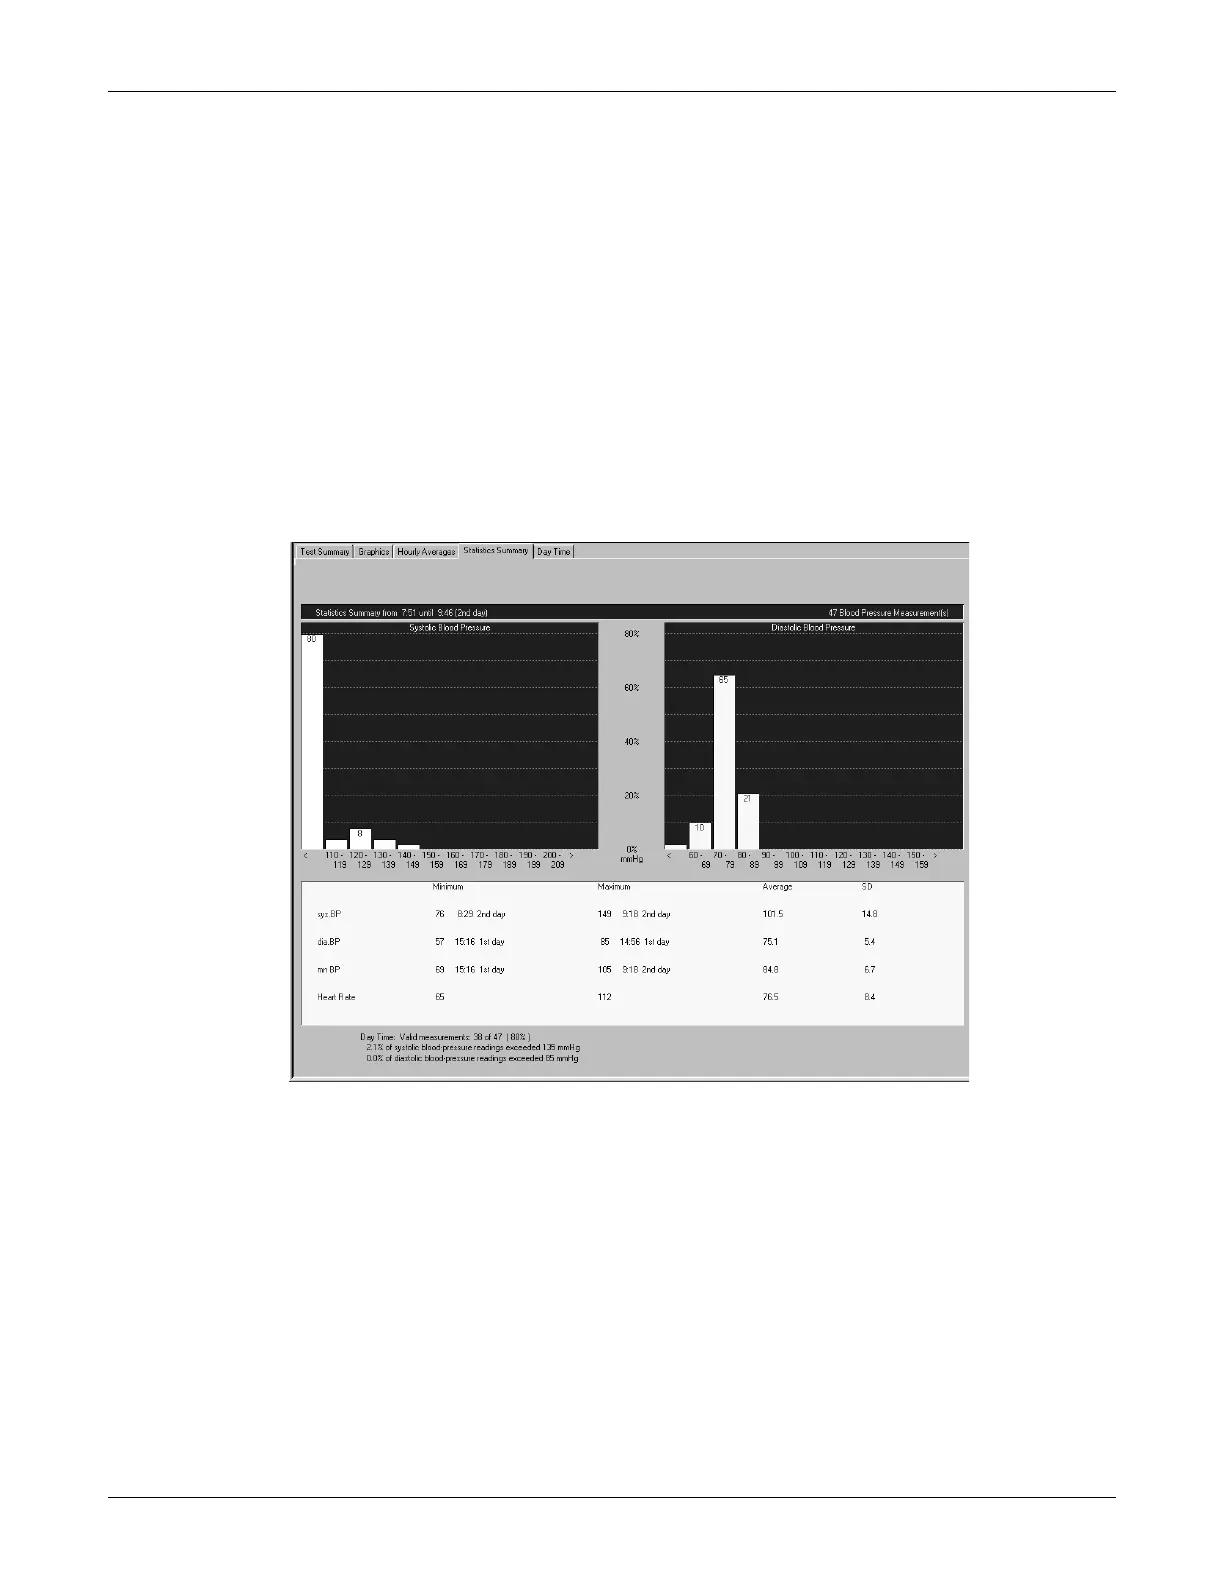
The Statistics Summary shows one histogram each for the systolic values
(left) and the diastolic values (right) as well as the frequency distribution
given as a percentage.
The table below indicates the maximum, minimum and mean values as
well as the standard deviations.
The percentage of readings that exceeded the set limits is shown at the
bottom.
Similar report pages exist for the day time, the night time and the wake-
up time.