8.6.1 Numerical display
12345
59 59
59 59
59 59
96 96
96 96
30 30
30 30
78 77
62 62
60 60
12:58
12:58
12:53
12:48
12:43
12:38
12:33
12:28
12:23
12:18
12:13
AA
AA
AA
AA
AA
AA
AA
AA
AA
AA
0.0 0.0
0.0 0.0
-- --
-- --
-- --
0.0 0.0
0.0 0.0
0.0 0.0
-- --
-- --
0
0
-- --
-- --
-- --
0
0
0
--
--
--
--
--
--
--
-- --
-- --
-- --
-- --
--
--
--
--
--
--
--
--
--
--
--
--
-- --
CO
2
%N
2
%O
2
O%Agent
Time
Fi Et Fi Et Fi Et Fi Et
%
70
69
Min
5
3
1
2
4 5
6
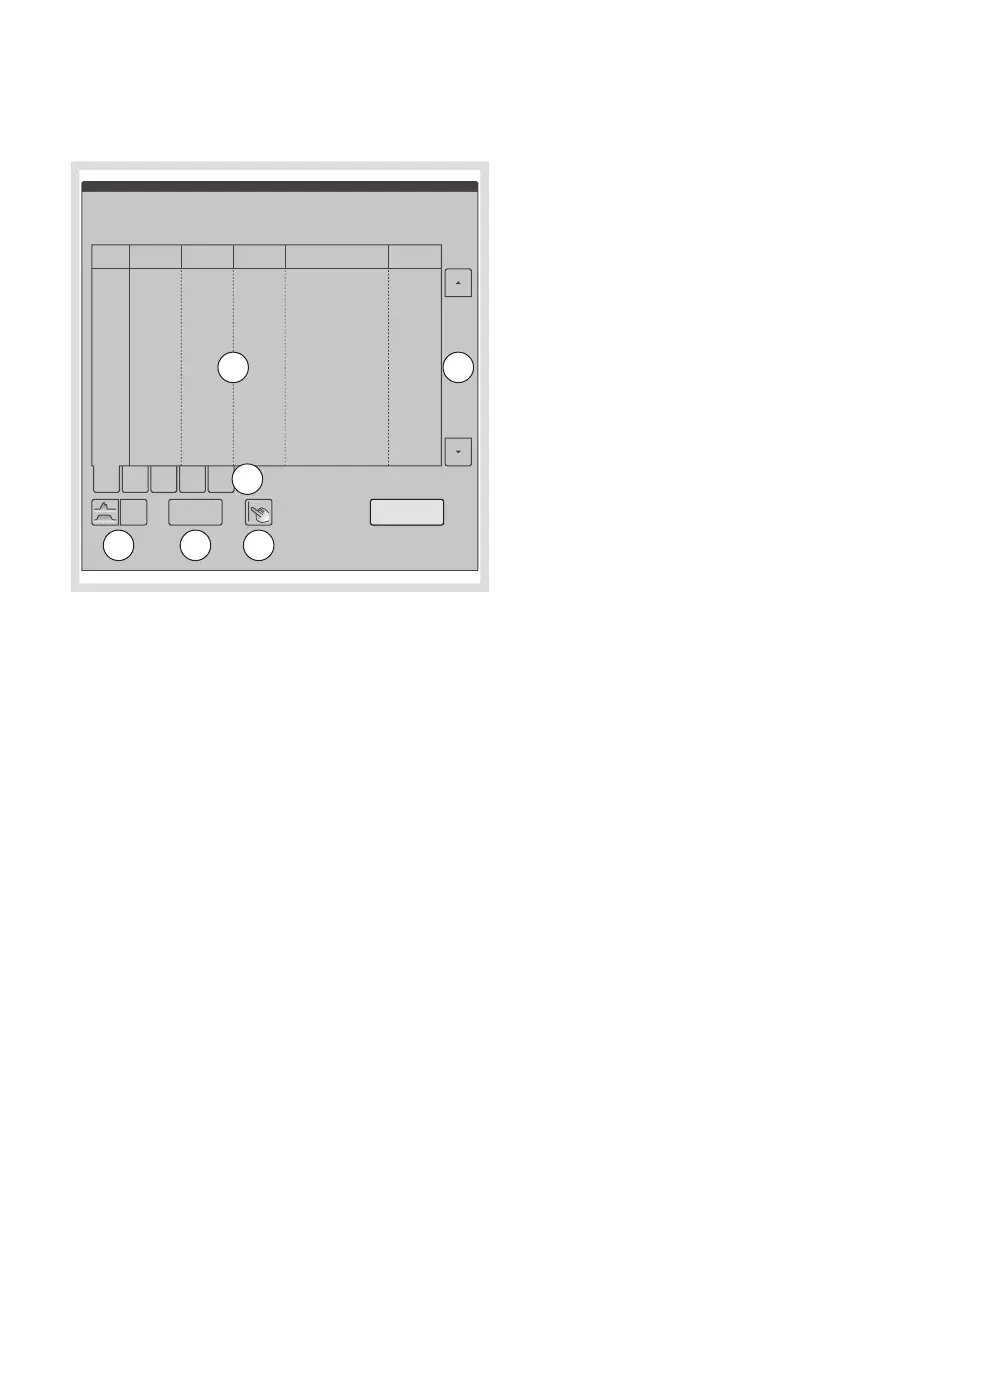
1. Numerical display
2. Trend window page tab
3. Graphic/numerical touch pad
4. Time interval touch pad
5. Cursor
6. Scroll bar
The different trends are displayed as five
pages of information. Each page is selected
using the page tabs below the trend data.
In the numerical view, the trend data is
displayed for the last 24 hours.
Different intervals can be selected from 1
minute to 60 minutes, with 10 values displayed
at one time in the window.
A blue horizontal line marking the top row in
the trends window can be activated and
moved up and down to facilitate reading. It is
activated either by pressing the trends window
or by pressing the cursor touch pad. The line
is moved using the rotary knob, or by pressing
and moving a finger across the trends window.
8.6.2 Scroll bars
Scroll bars are used to navigate through listed
information or available values. Select the
scroll bar, positioned to the right of the
window, by pressing it on the touch screen.
Press the up and down arrows on the scroll
bar, or use the rotary knob, to move up and
down the list.
160
FLOW-i 4.2, User's Manual
| 8
| Membrane buttons |
 Loading...