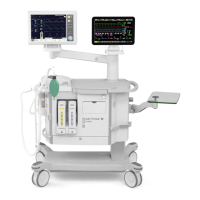
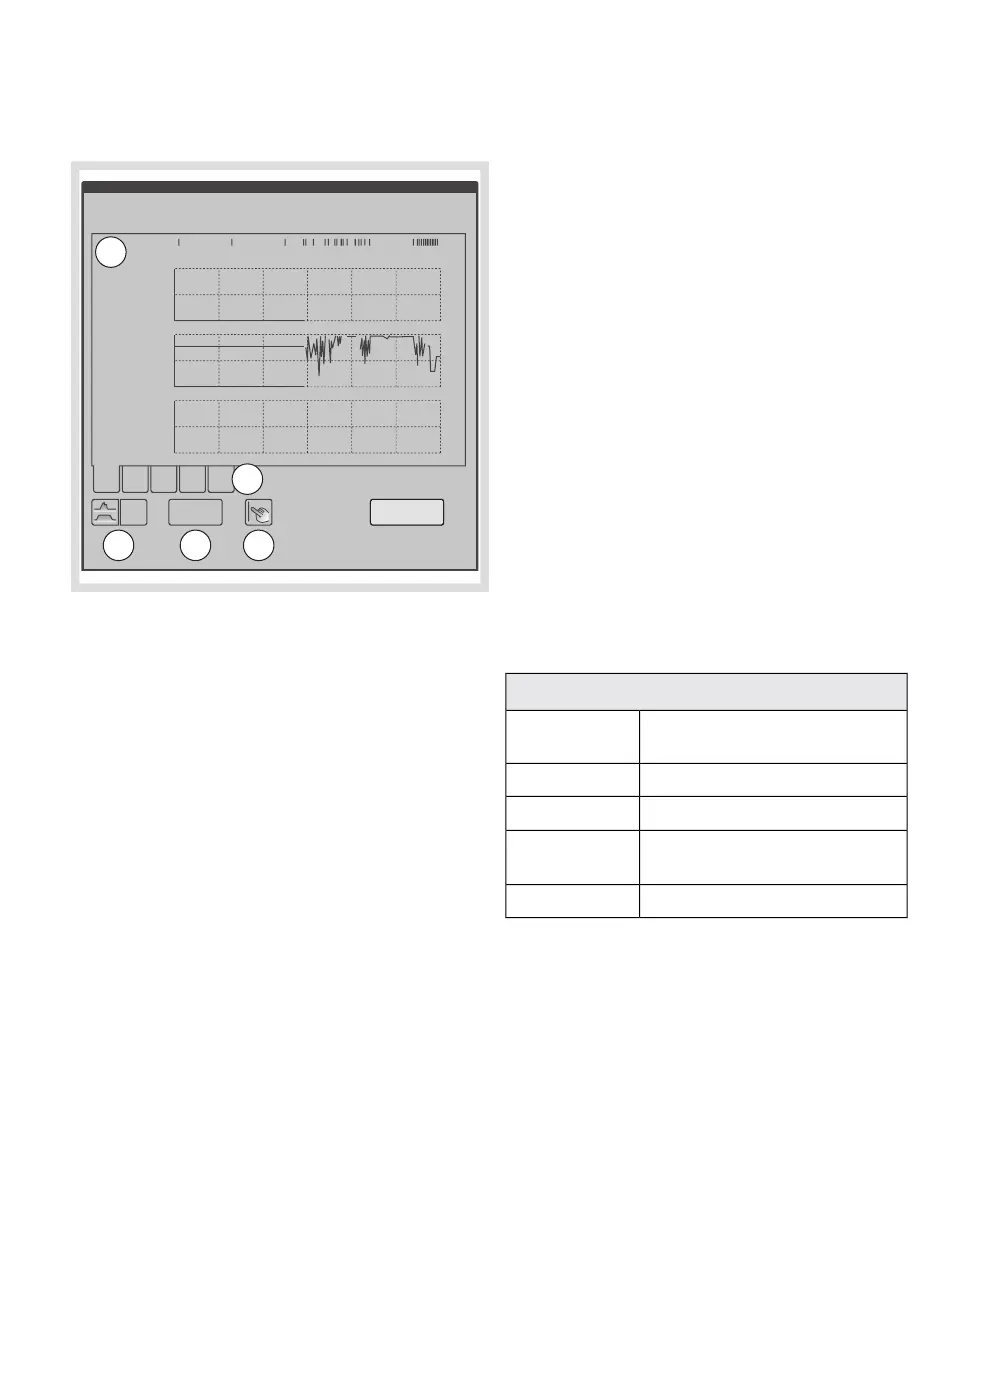
8.6.3 Graphical display
12345
59
59
0
2
0
100
0
2
0
06:58 07:58 08:58 09:58 10:58 11:58 12:58
12:58
FiAA
0.0
0.0
EtO
2
O
O
FiO
2
FiCO
2
EtCO
2
%
%
%
FiN
2
EtN
2
EtAA
70
69
H
6
1
3 4 5
2
1. Graphical display
2. Trend window page tab
3. Graphic/numerical touch pad
4. Time interval touch pad
5. Cursor
The different trends are displayed as five
pages of information. Each page is selected
using the page tabs below the trend data.
The time scale for the graphs can be changed
from 1 hour up to 24 hours.
A blue vertical line marking the latest sampling
point in the graphical display window can be
activated and moved left and right to facilitate
reading the waveforms. It is activated either
by pressing the display window or by pressing
the cursor touch pad. The line is moved using
the rotary knob, or by pressing and moving a
finger across the display window. The exact
time and measured value corresponding to
the current position of the line are displayed
in the top left, and left part of the display
window respectively.
At the top of the window, log events are
displayed as small white vertical lines. These
events are located at positions that
correspond to the occurrence of the event.
They can only be accessed and examined by
moving the vertical line to match their position.
When a log event is accessed by the cursor,
the related log information is displayed in the
trend window.
8.6.4 Page information
Trended measurements are displayed on each
of the five pages according to the table below:
Trend data - page information
Ppeak, Pmean, PEEP, Pplat,
MVi, MVe
Page 1
RR, VTi, VTe, VT/PBWPage 2
Vee, Ti, Ti/Tot, I:E
4
,CdynPage 3
CO
2
% , O
2
%, N
2
O %, AA % (Fi
+ Et)
Page 4
MAC, FGFPage 5
4. Not shown when graphical display is selected
FLOW-i 4.2, User's Manual
161
| Membrane buttons |
8 |
 Loading...