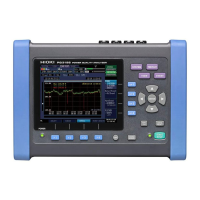
1-Screen
2-Screen
Trend
Displays the RMS value measured using data collected over ap-
proximately 200 ms, the average value of peak or other values
during the TIME PLOT interval, or the maximum, minimum, and
average values as a time series, showing one per screen.
Displays the RMS value measured using data collected over ap-
proximately 200 ms, the average value of peak or other values
during the TIME PLOT interval, or the maximum, minimum, and
average values as a time series, showing two per screen.
See: 7.2 (p.114)
Monitor changes in
measured values
(TIME PLOT screen)
The [TIME PLOT] screen is used to view RMS, voltage,
and harmonic fluctuations as time series graphs. Flicker
values can also be shown as a graph or list.
Press the TIMEPLOT key to display the [TIME PLOT]
screen. The screen can be changed with the DF keys.
Energy
Displays the active energy (WP+/WP-) or reactive energy
(WQLAG/WQLEAD) as selected.
DtlTrend
DetailTrend
Displays the maximum and minimum values during the TIME
PLOT interval for RMS voltage refreshed each half-cycle, inrush
current, Pinst, frequency cycle, or other characteristics measured
in half-cycle or one-cycle units.
See: 7.3 (p.121)
Harmonics
Interharm*
HarmTrend
Can display 6 orders of harmonics. Displays the average value or
maximum, minimum, and average value during the TIME PLOT
interval as a time series. (You can select voltage, current, power,
or phase to be displayed.)
Can display 6 orders of inter-harmonics. Displays the average
value or the maximum, minimum, and average values during the
TIME PLOT interval as a time series. (You can select voltage or
current to be displayed.)
*: Inter-harmonics are displayed when [Recording Items] is set
to [All data].
See: 7.4 (p.127)

 Loading...