pgm
84-C
Figure 6-11. Log Magnitude Format
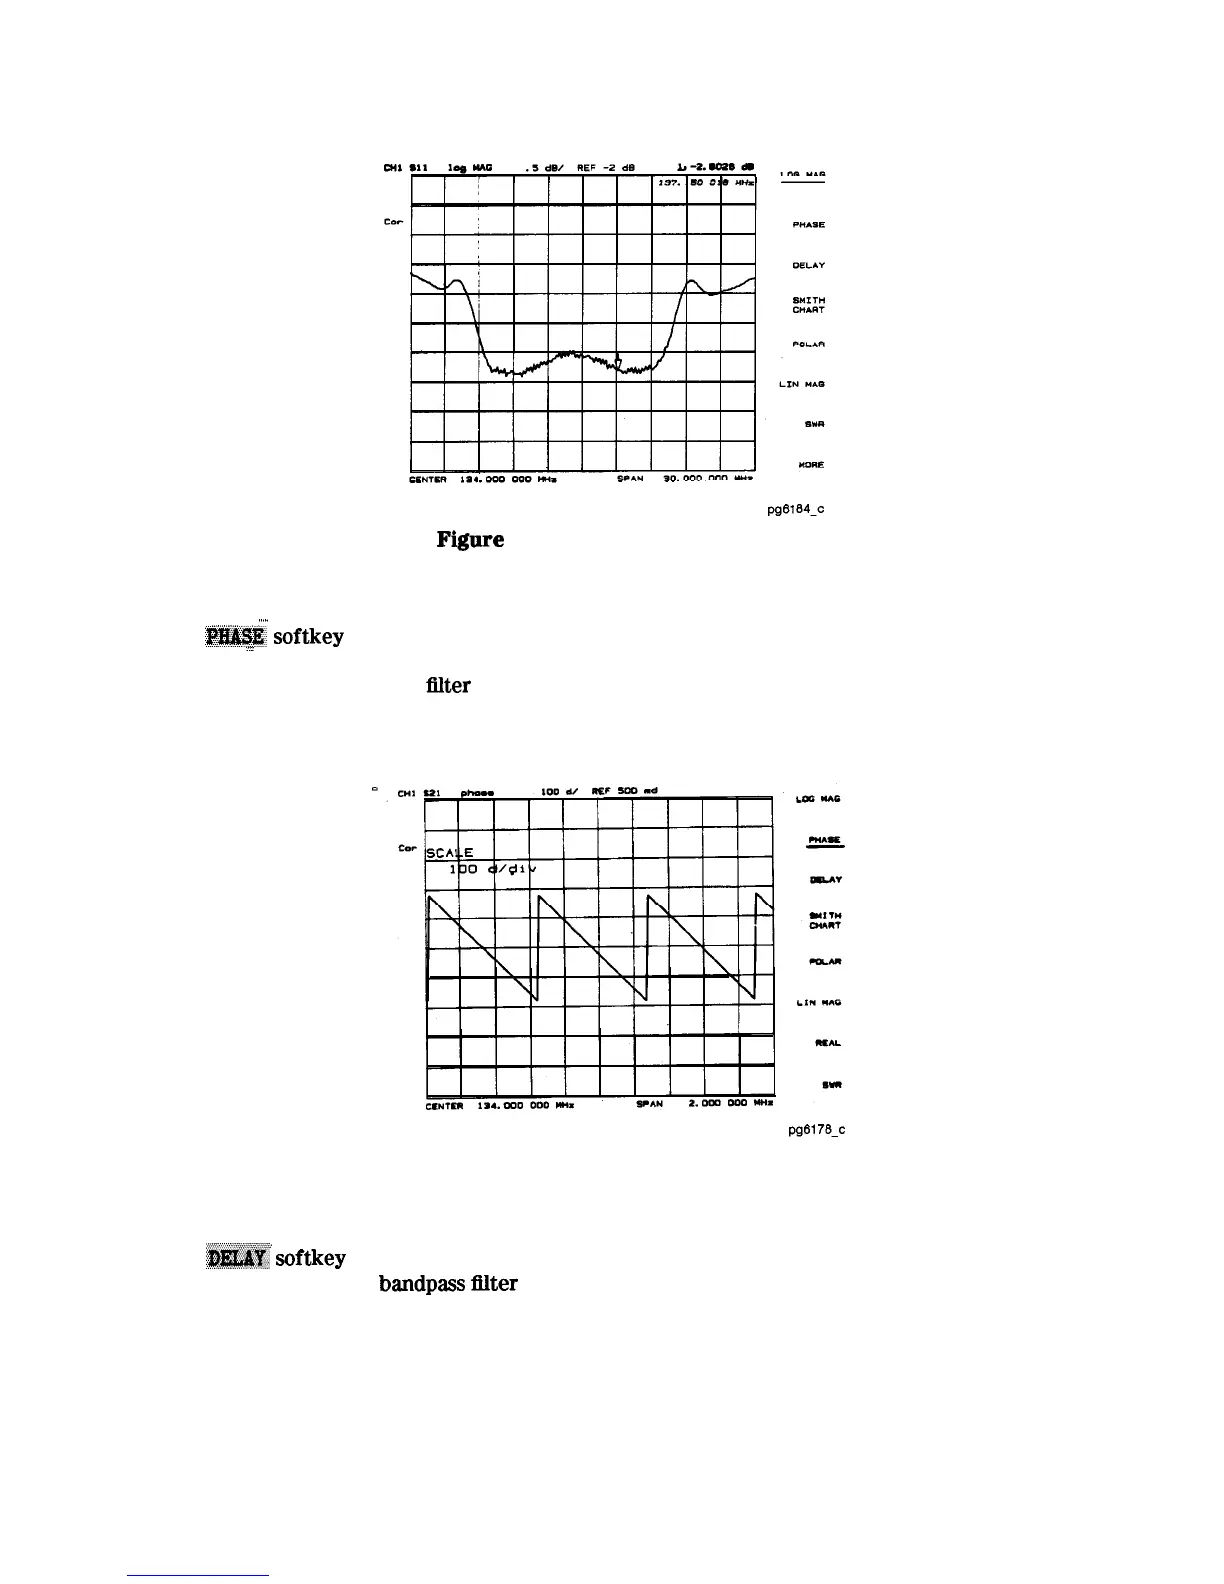
Phase Format
. . . . . . . . . .
,,,.
The
$!?K
softkey displays a Cartesian format of the phase portion of the data, measured
..:
in degrees This format displays the phase shift versus frequency. Figure 6-12 illustrates the
phase response of the same
IIlter
in a phase-only format.
pg6170-c
Figure 6-12. Phase Format
Group Delay Format
._
..;
,.,,/./
;,.
The
~~~~~;
softkey selects the group delay format, with marker values given in seconds.
Figure 6-13 shows the
bandpass
Illter
response formatted as group delay. Group delay
principles are described in the next few pages.
Application and Operation Concepts
6-33

 Loading...


