[E xit] E xits the spectrum m easurem ent program and returns to [S pectra
M anager].
[H elp] m enu
[A bout...] D isplays inform ation such as the program version.
5.1 [M easurem ent] m enu
5.1.1 [S tart]
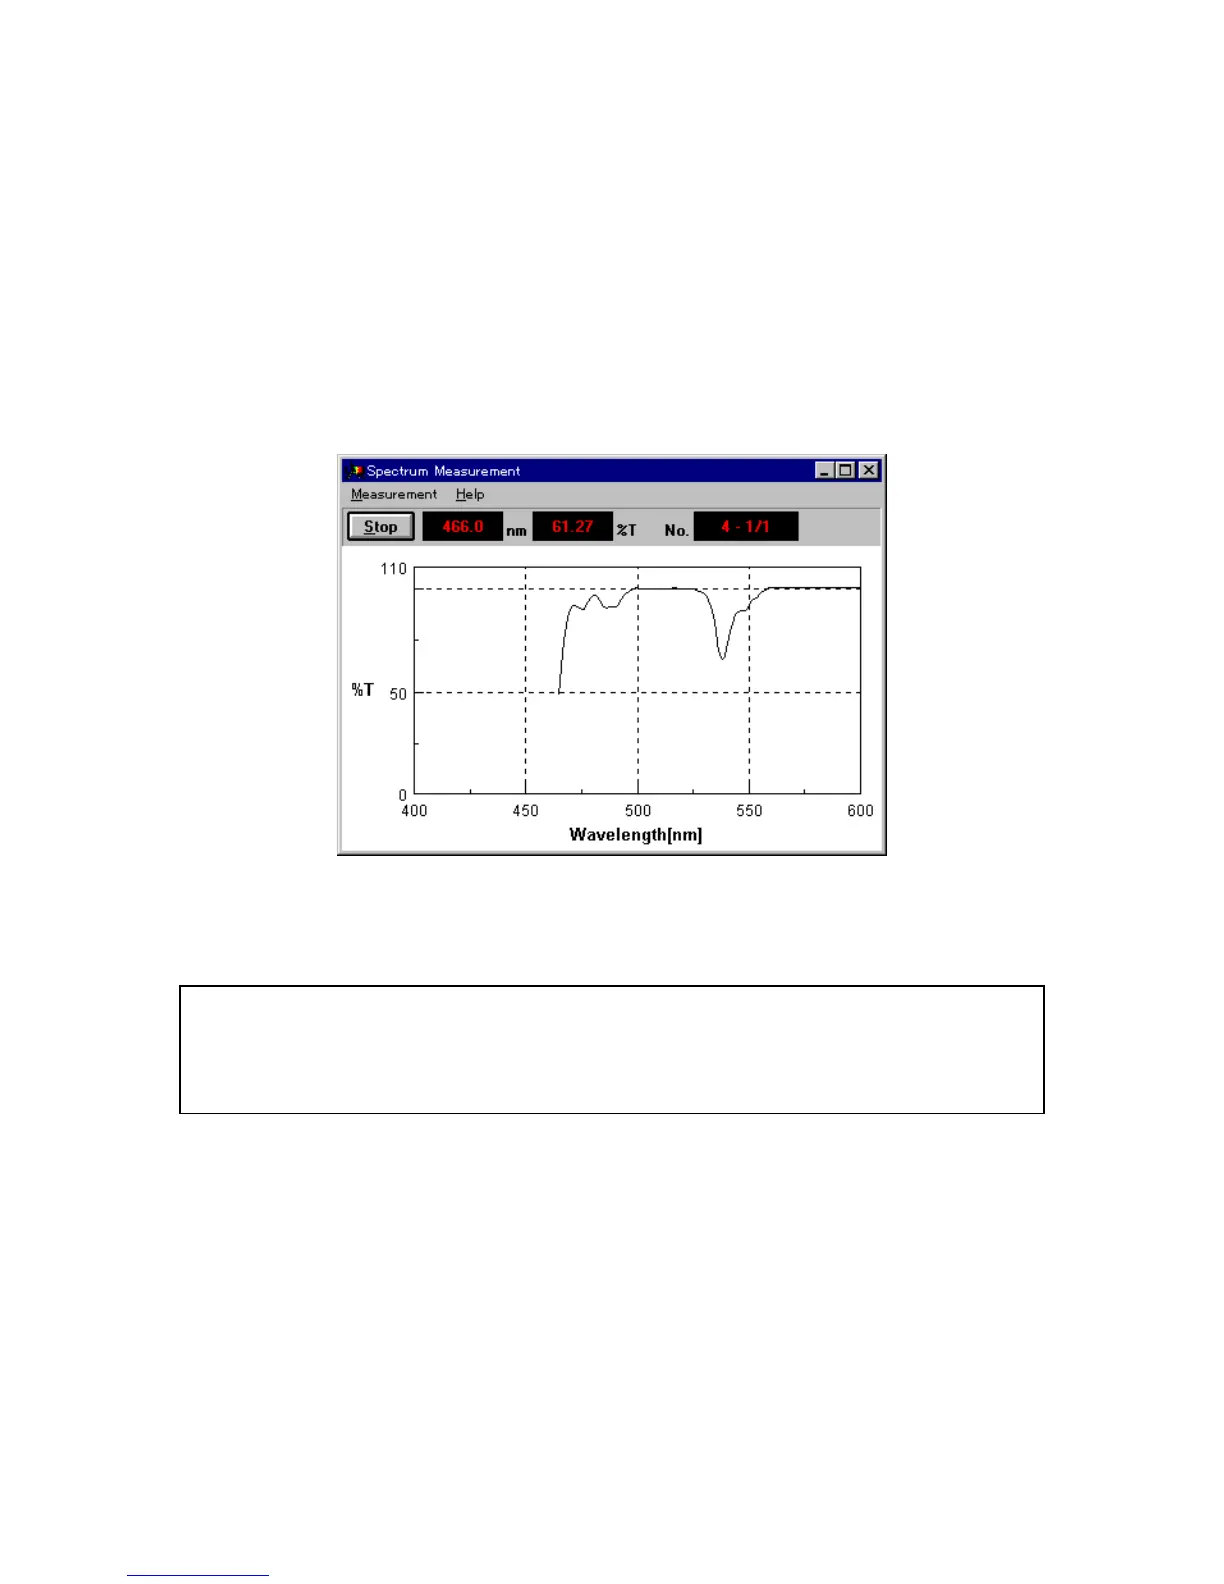
S tarts spectrum m easurem ent. The spectrum is displayed in real tim e. D uring m easurem ent, the vertical
axis of the spectrum is set from 0 to 1 A bs in the photom etric m ode or 0 to 100 in the T% m ode.
F igure 5.2 M easurem ent w indow
W hen m easurem ent has finished, a new w indow opens w hich displays a spectrum on the vertical axis set
from the [P aram eters] dialog box. A t the sam e tim e, the spectra analysis program starts.
N ote 1: A fter activating spectra analysis and starting initial m easurem ent, the next view show ing the results covers
the [S pectrum V iew ], and hides it. T o save the hidden [S pectrum V iew ], save or print it. T o display the
hidden [S pectrum V iew ] again, change the application.
N ote 2: If m easurem ent in progress in interrupted, the [S pectrum V iew ] displays all data up to that point.
5.1.2 [P aram eter...]
H ere you set and save param eters. C lick the [D ata File] tab to set inform ation such as the filenam e for
autom atically saving m easurem ent data.
5.1.2.1 [Parameters] dialog box
C lick [M easurem ent] - [P aram eter...] to display the follow ing dialog box.