5-12 Operator’s Manual – OPTI CCA-TS
5 SAMPLE HANDLING AND PATIENT TESTING
When the analysis is completed, the status light
stops blinking and the instrument alerts you that the
measurement has been completed with a “beep”.
At this time you may continue entering or editing the
patient information until you have completed it or
display the results immediately by pressing
at any time.
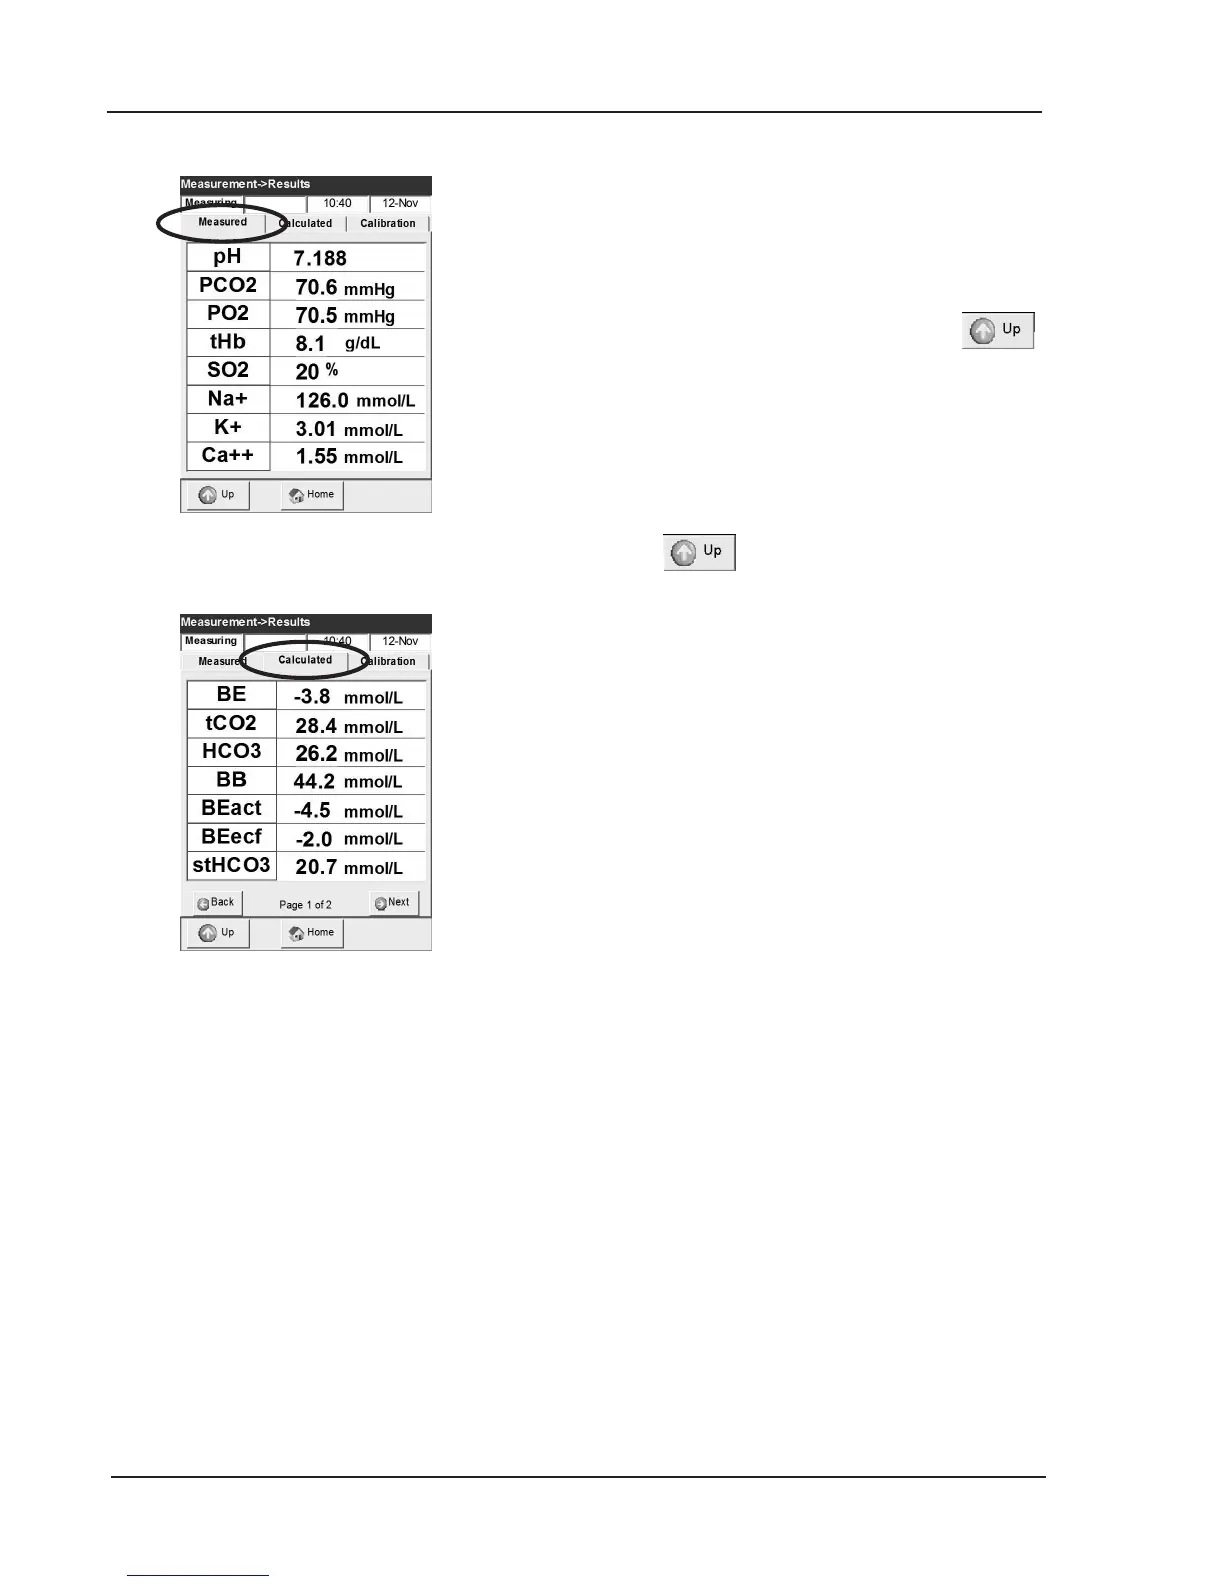
If the screen has not been touched for approximately
three (3) minutes the results will automatically be
displayed (Fig. 5-21).
The second tab displays the calculated parameters
(Fig. 5-22).
18. Press to move directly to the next
sample display.
• If patient temperature was input, it will be
displayed in place of a calculated parameter.
In this case, the blood gas values displayed are
temperature corrected.
• The display will show results according to the
type of sensor cassette used (See Chapter 9.2,
Sensor Cassettes).
• The resolution of the measured parameters may
be congured “HIGH” (Na
+
= 156.4 mmol/L) or
“LOW”(Na
+
= 156 mmol/L) in the setup menu
(See section 3.3.2.6).
• The OPTI CCA-TS Analyzer “ags” values that
are above or below the programmed ranges with
an up or down arrow. If the value is outside the
measurable range, a ‘HIGH’ or ‘LOW’ will be
displayed and a > or < with a range printed out
in the message section on the patient report.
• When a value for any measured parameter can
not be determined, the display will show a series
of dashes “----” and the printout will contain
an error message stating that the result was
suppressed.
• When a possible measurement error occurs, the
OPTI will ag patient results with a “?” on the
display and printout and a blinking result on the
screen. Repeat the measurement if possible.
WARNING: Treatment should never be administered
based on results that are agged on the
printout.
Fig. 5-21 Measurement results
Fig. 5-22 Calculated results