Diagnostics and Troubleshooting PLX32-EIP-MBTCP-UA ♦ Multi-Protocol Gateway
User Manual
Page 36 of 156 ProSoft Technology, Inc.
March 8, 2018
3.2.2 Capturing a Diagnostic Session to a Log File
You can capture anything you do in a Diagnostics session to a log file. This
feature can be useful for troubleshooting and record-keeping purposes, and for
communication with ProSoft Technology’s Technical Support team.
To capture session data to a log file
1 Open a Diagnostics window. See Using Diagnostics in ProSoft Configuration
Builder (page 33).
2 To log a Diagnostics session to a text file, from the toolbar, click the LOG FILE
button. Click the button again to stop the capture.
3 To view the log file, from the toolbar, click the VIEW LOG FILE button. The log
file opens as a text file, you can rename and save to a different location.
4 To email the log file to ProSoft Technology’s Technical Support team, from
the toolbar, click the EMAIL LOG FILE button. This only works if you have
installed Microsoft Outlook on your PC.)
5 If you capture multiple sequential sessions, PCB appends the new data to the
end of the previously captured data. If you want to clear the previous data
from the log file, you must click the CLEAR DATA button each time before you
start capturing data.
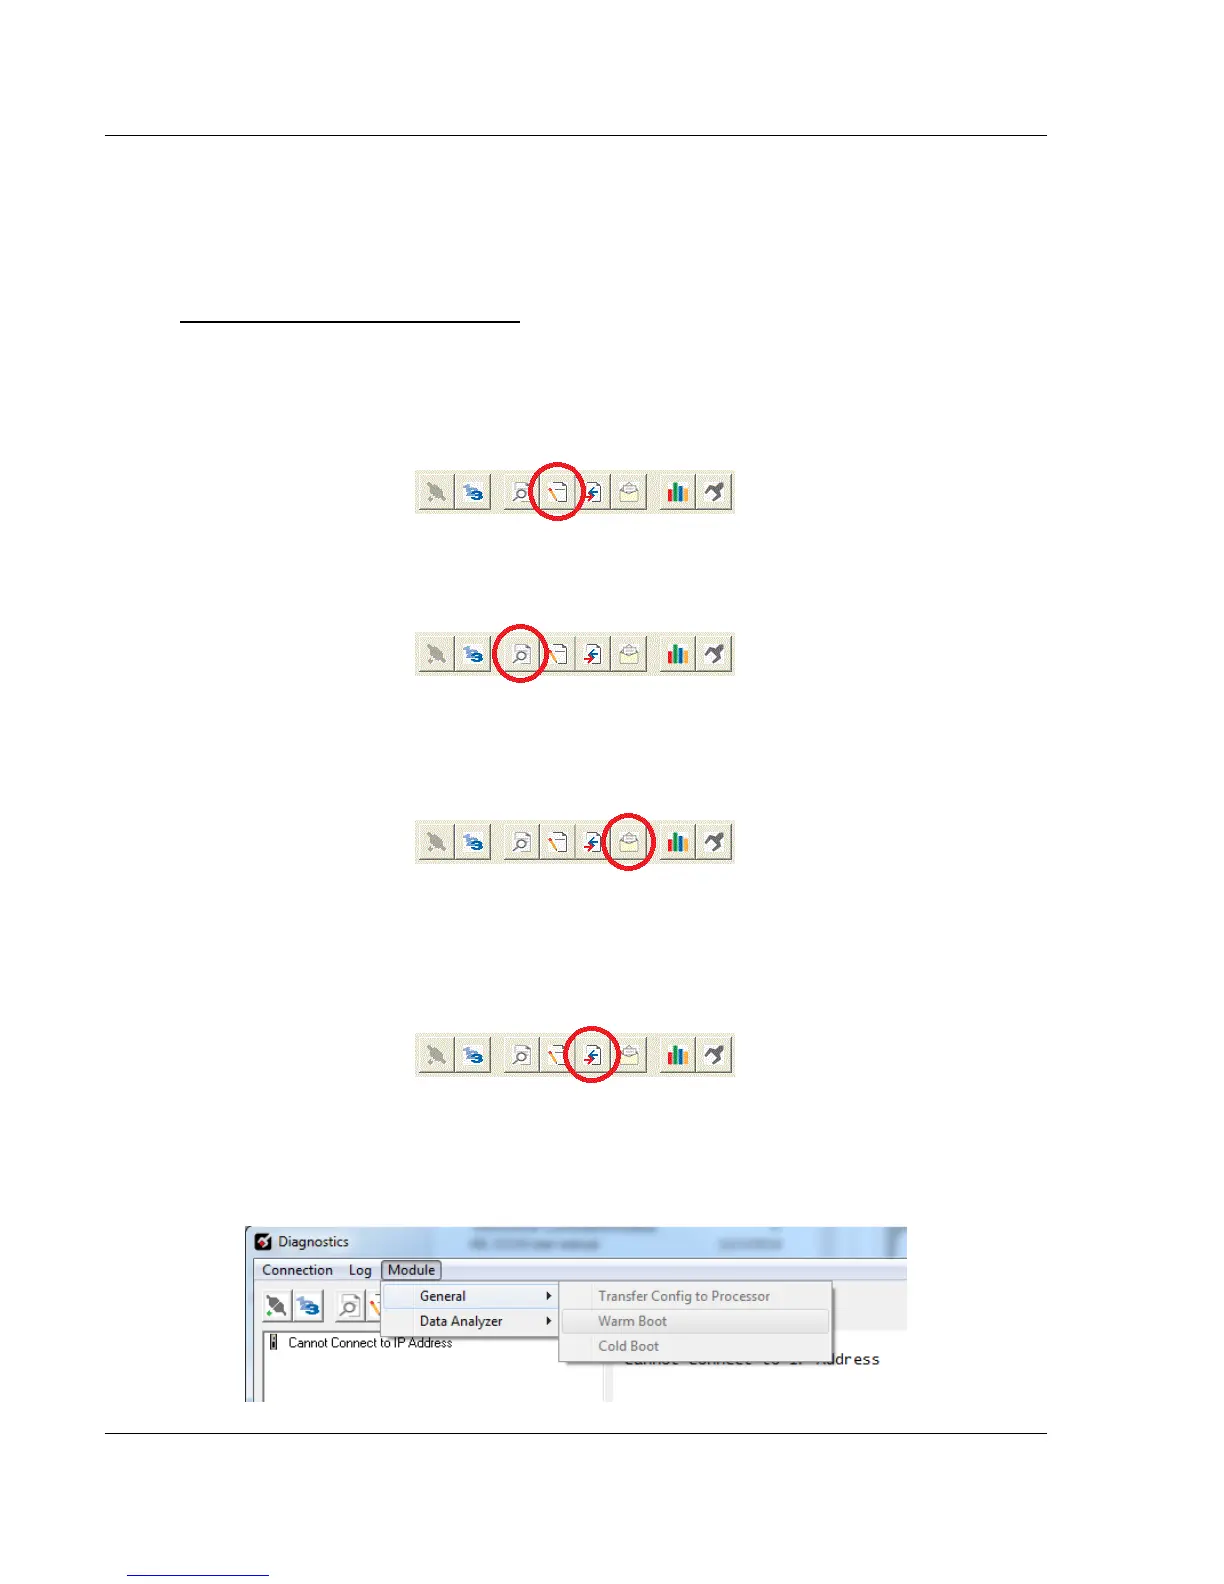
3.2.3 Warm Boot / Cold Boot
Warm and Cold booting the PLX32-EIP-MBTCP-UA can be done by clicking
MODULE > GENERAL > WARM BOOT or COLD BOOT.