The Spectrum Application
R&S
®
FPC
93User Manual 1178.4130.02 ─ 07
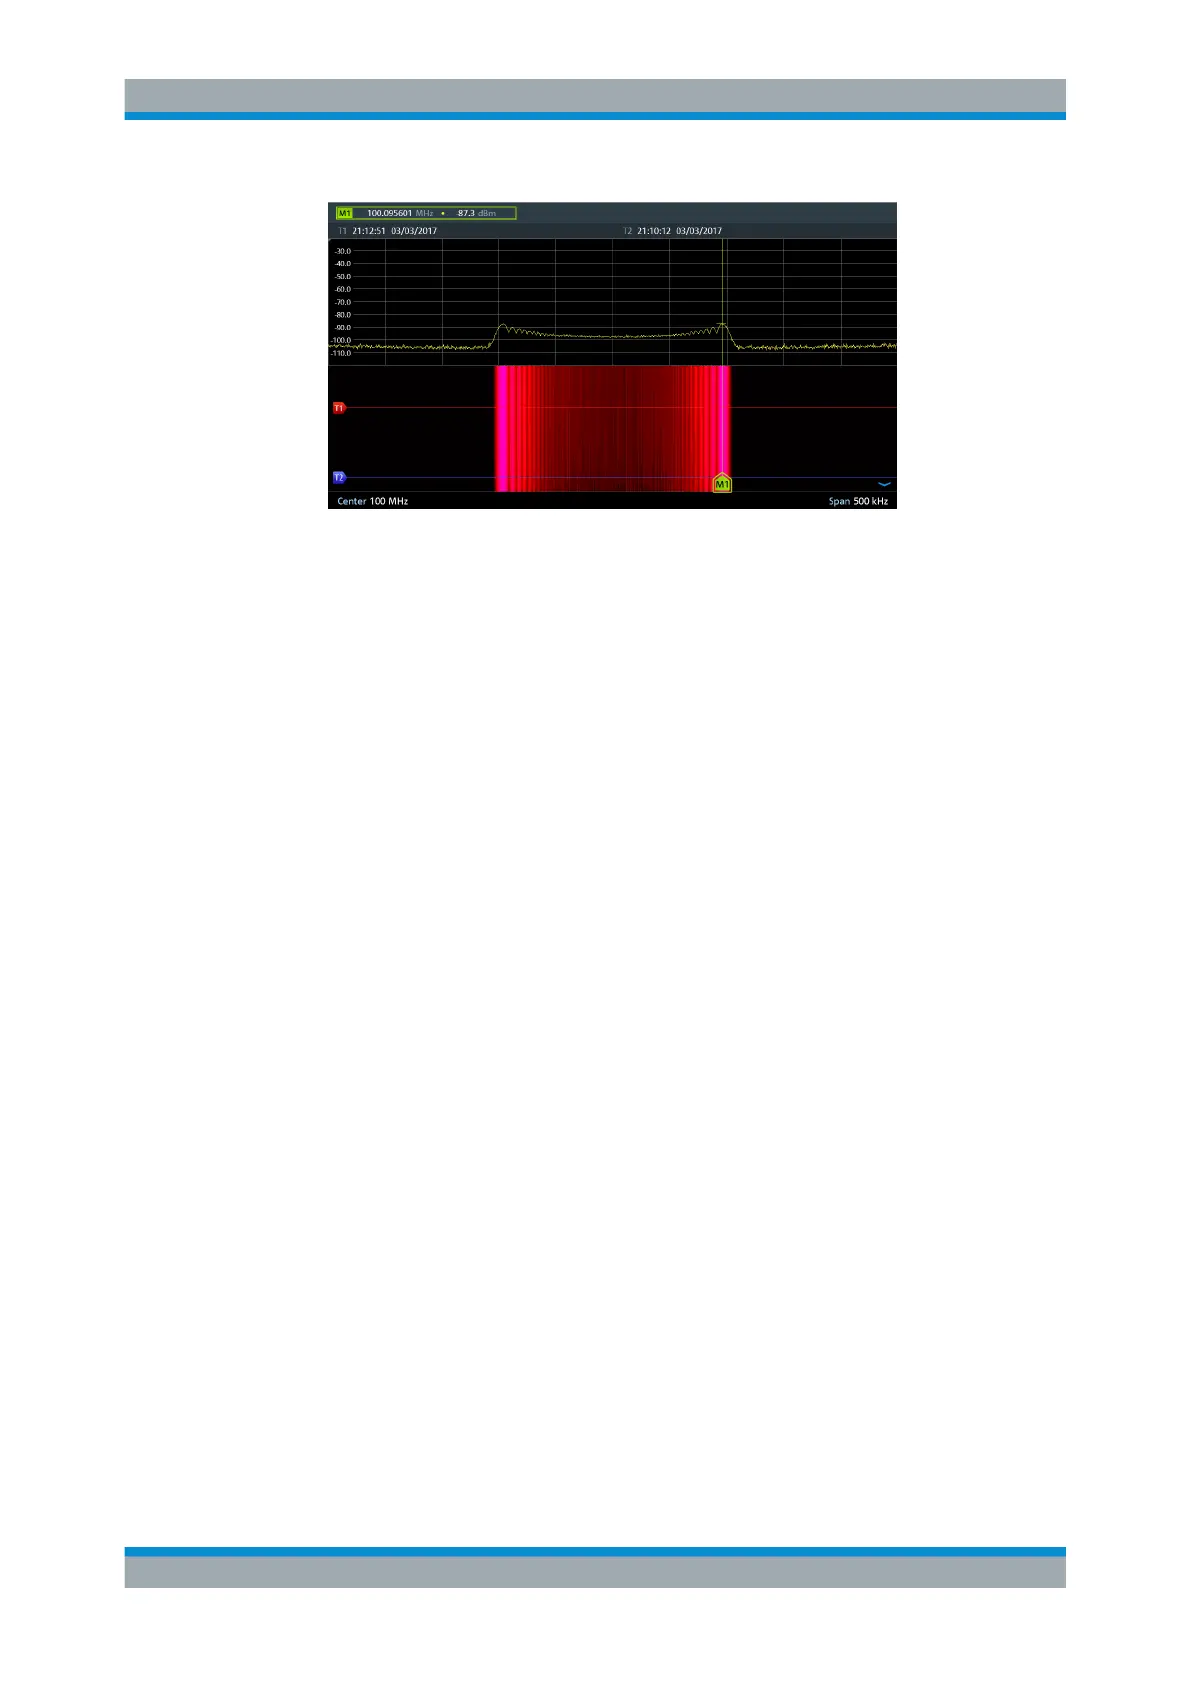
Figure 14-6: Time lines and markers in the spectrogram
Switching back to active spectrogram recording
You can presume the spectrogram recording from playback mode.
1. Press the "Meas" key to open the measurement menu.
2. Select the "Live Update" menu item.
The R&S FPC switches back to a live measurements.
14.3 Frequency Configuration
Access (frequency menu): "Freq"
Access (span menu): "Span"
Access: "Setup" > "Config Overview" > "Frequency" (selected settings)
Remote commands to configure the frequency:
●
Chapter 19.12.2, "Frequency", on page 245
The main application of a spectrum analyzer is to measure the frequency and the
power level of a signal and show these signal characteristics in a diagram. The x-axis
of the diagram usually contains the frequency information of the signal, while the y-axis
usually contains the level information.
Regarding the frequency information, a typical measurement task does not require you
to measure the characteristics of the complete frequency range supported by the
R&S FPC. Instead, it is usually sufficient to measure the characteristics of a limited fre-
quency range only.
The R&S FPC provides several settings to control the frequency range it actually
measures.
You can define the frequency range in various ways.
●
In terms of a center frequency and the span around it.
Frequency Configuration