GCMS-QP2010 Series Operation Guide 5
2.3 Inspecting Consumable Items and Maintenance Parts
2
The assistant bar, instrument monitor, and Data Explorer can be shown or hidden by selecting [Show/Hide]
on the [View] menu.
2.3
Inspecting Consumable Items and Maintenance
Parts
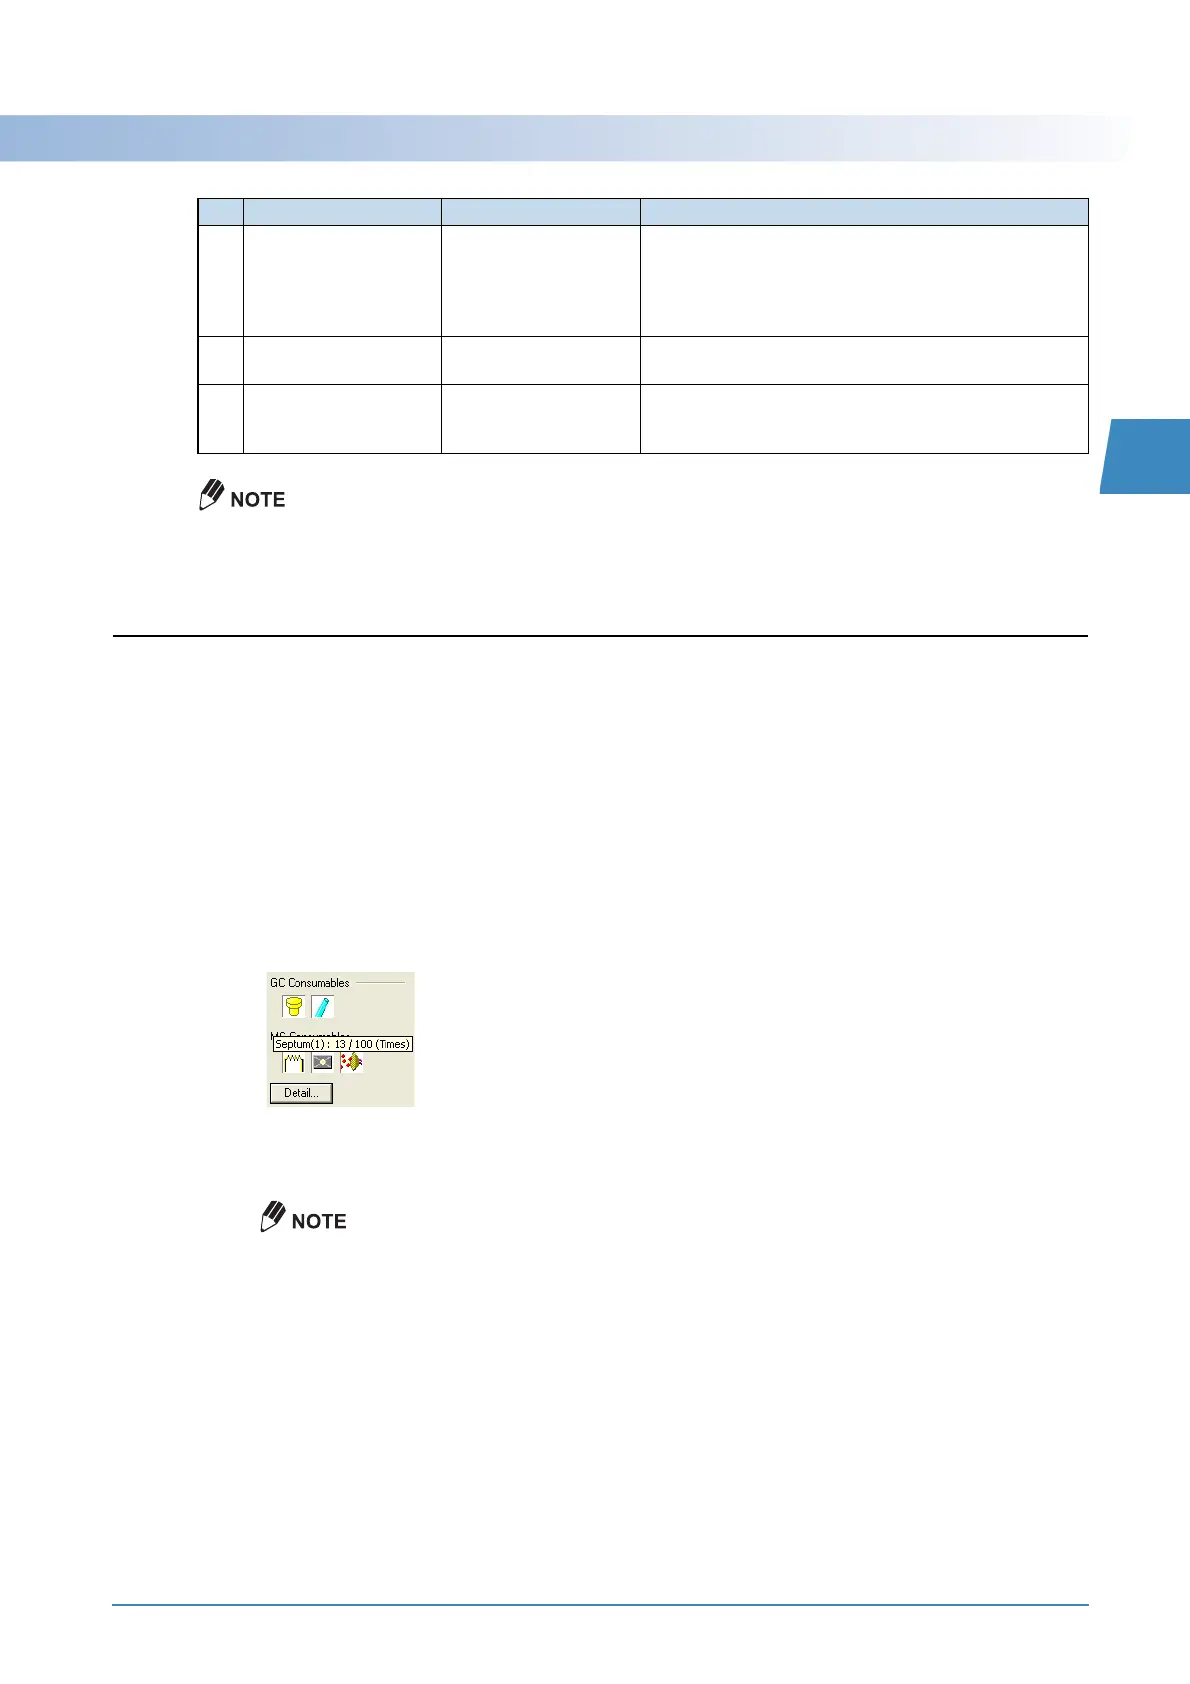
Check the state of the GC/MS consumable items using the procedure described below.
1
Move the mouse pointer over the icon for a consumable item in the instrument monitor
to display the current state and the recommended replacement point for the
corresponding item.
When a consumable item approaches its recommended maximum usage frequency, the background of
the corresponding icon turns black to alert the user.
This note is shown when mouse pointer is moved over the septum icon. This means that the septum has
been used 13 times out of a maximum 100 times.
When replacing the analysis column, or when a consumable item has passed its recommended
replacement point, perform maintenance with reference to "Appendix D Maintenance" P.83.
Depending on the analysis content, the appropriate replacement frequency may be greater than the
recommended frequency.
4
Assistant Bar Real Time Analysis,
Analysis Editor, Postrun
Analysis, and Browser
Command icons are arranged in order of typical operation
sequence. The assistant bar is named according to the
window that is currently open. For example, when the
[Batch] window is open, the assistant bar is named the
[Batch] assistant bar.
5
Instrument Monitor Real Time Analysis Displays analytical instrument parameter values in real
time.
6
Data Explorer Real Time Analysis,
Analysis Editor, Postrun
Analysis, and Browser
Used to easily load analytical data or method files. It lists
files in the selected folder, according to file type.
No. Name GCMS Program Explanation

 Loading...