G Displaying Chromatograms
98 GCMS-QP2010 Series Operation Guide
G.2
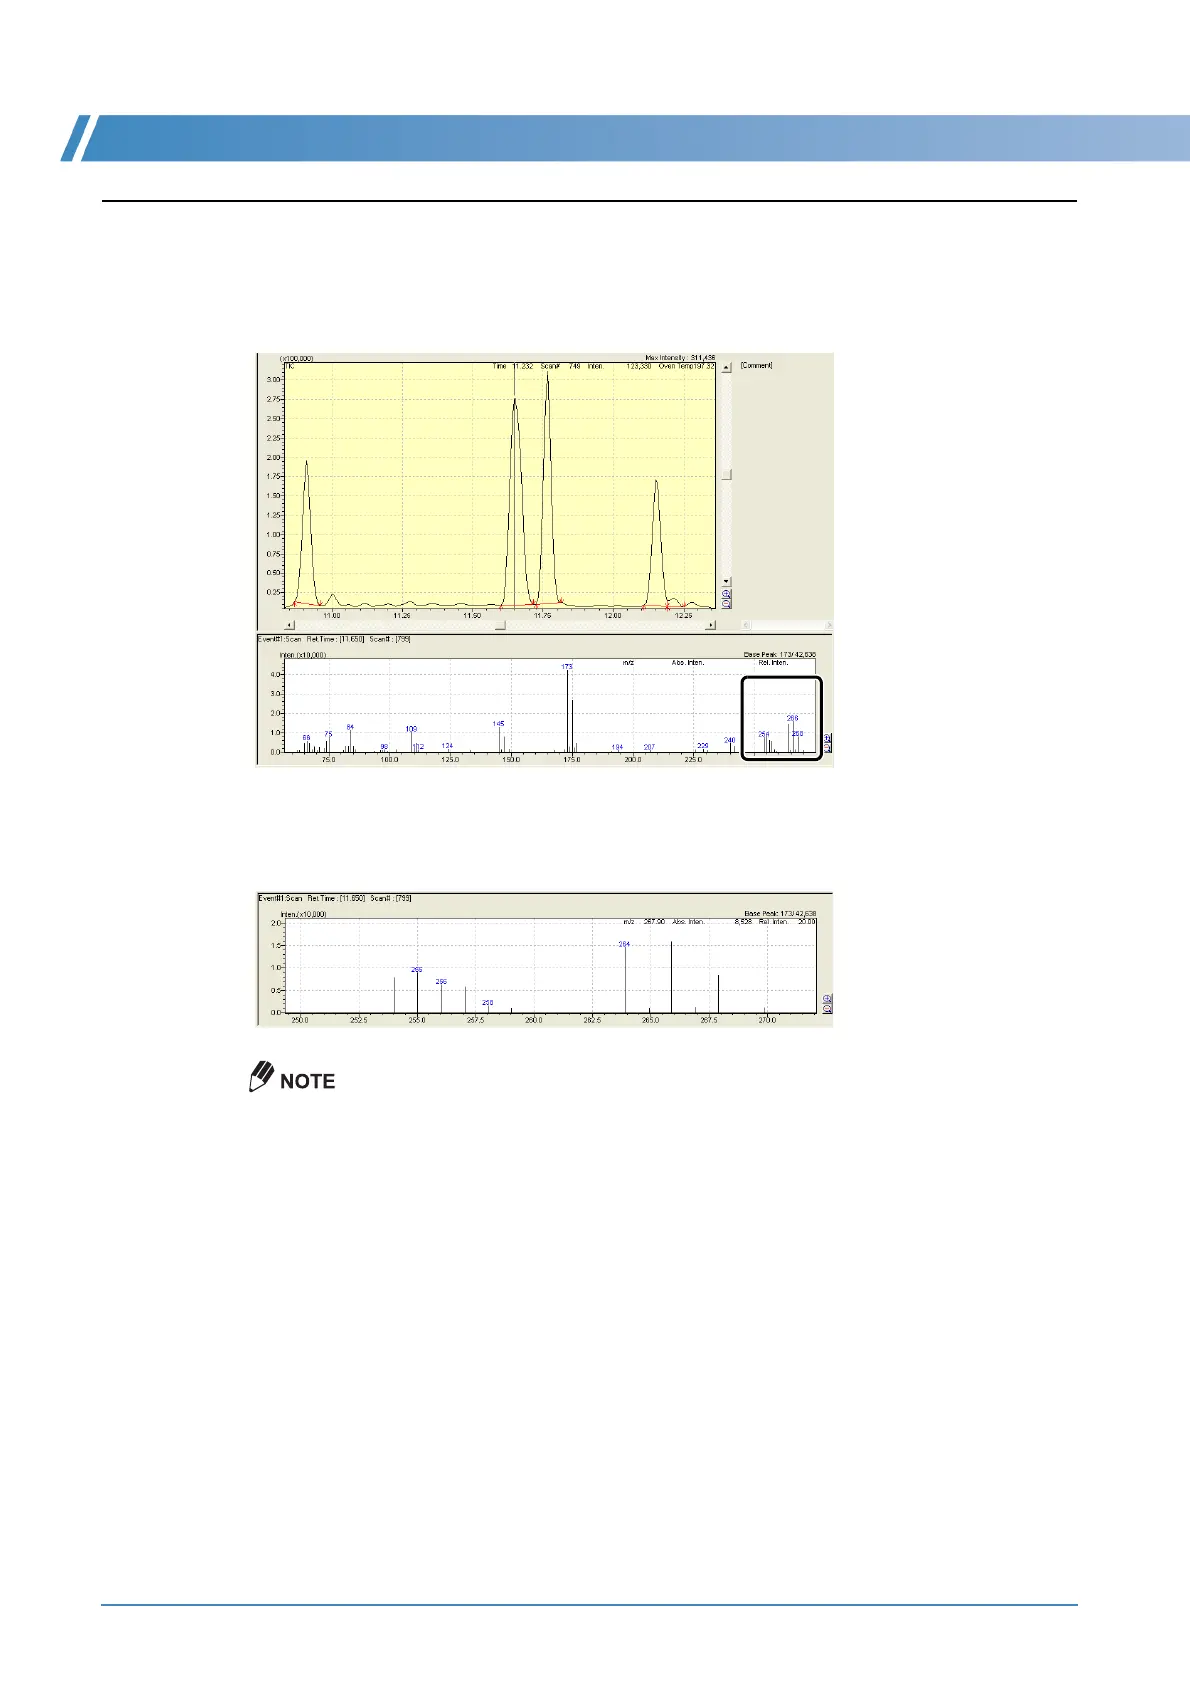
Displaying Chromatograms from Mass Spectra
1
In the mass spectrum, specify and enlarge the range containing the desired peaks by
dragging the mouse.
2
Move the mouse pointer to the spectral peak to be displayed and double-click.
A mass chromatogram is displayed in the MC window, enlarged by an automatically set enlargement rate.
• To hide the mass chromatogram, deselect the applicable cell in the [Disp.] column in the [MC
Fragment Table] window.
• To undo enlarging, right-click on the mass spectrum and select [Undo Zoom] on the menu that
appears.

 Loading...