J Printing Reports
116 GCMS-QP2010 Series Operation Guide
J.2.3
Manually Setting Report Content
1
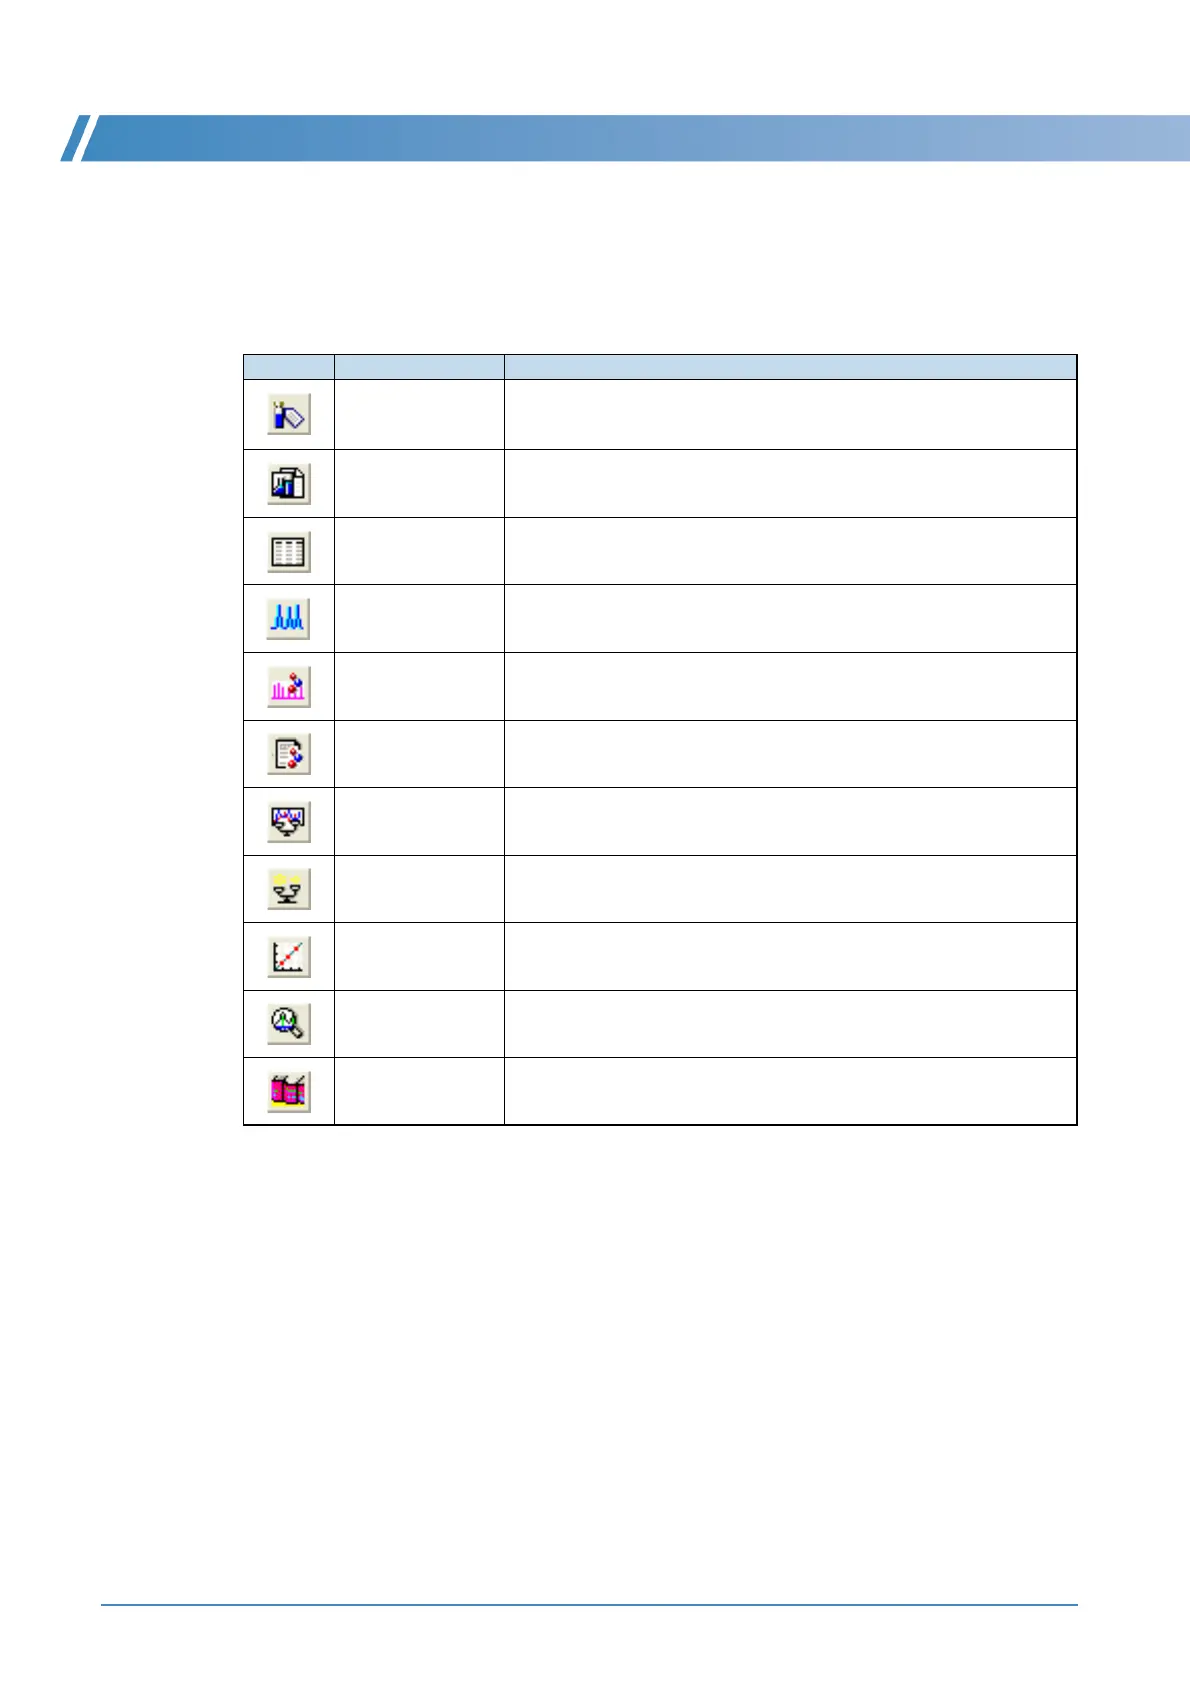
Click the buttons on the toolbar for the information to be printed or select the desired
items on the [Item] menu.
Icon Name Explanation
Sample information Select to print sample information.
Method Select to print methods.
Peak table Select to print the peak tables in qualitative tables.
Chromatogram Select to print the chromatograms (TIC, MIC, and MC).
Spectrum graph Select to print the mass spectra registered in spectrum processing tables.
Mass table Select to print the mass tables for the spectra registered in spectrum
processing tables.
Quantitative graph Select to print the chromatograms and quantitative values obtained in
quantitative results.
Quantitative table Select to print the tables obtained in quantitative results.
Calibration curve Select to print calibration curves.
Tuning Select to print the tuning results obtained when data acquisition is
executed.
Library search Select to print the library search results obtained for the mass spectra
registered in spectrum tables.
• Searches must be performed in the spectrum tables.

 Loading...