GCMS-QP2010 Series Operation Guide 41
4.4 Analyzing Data
4
2
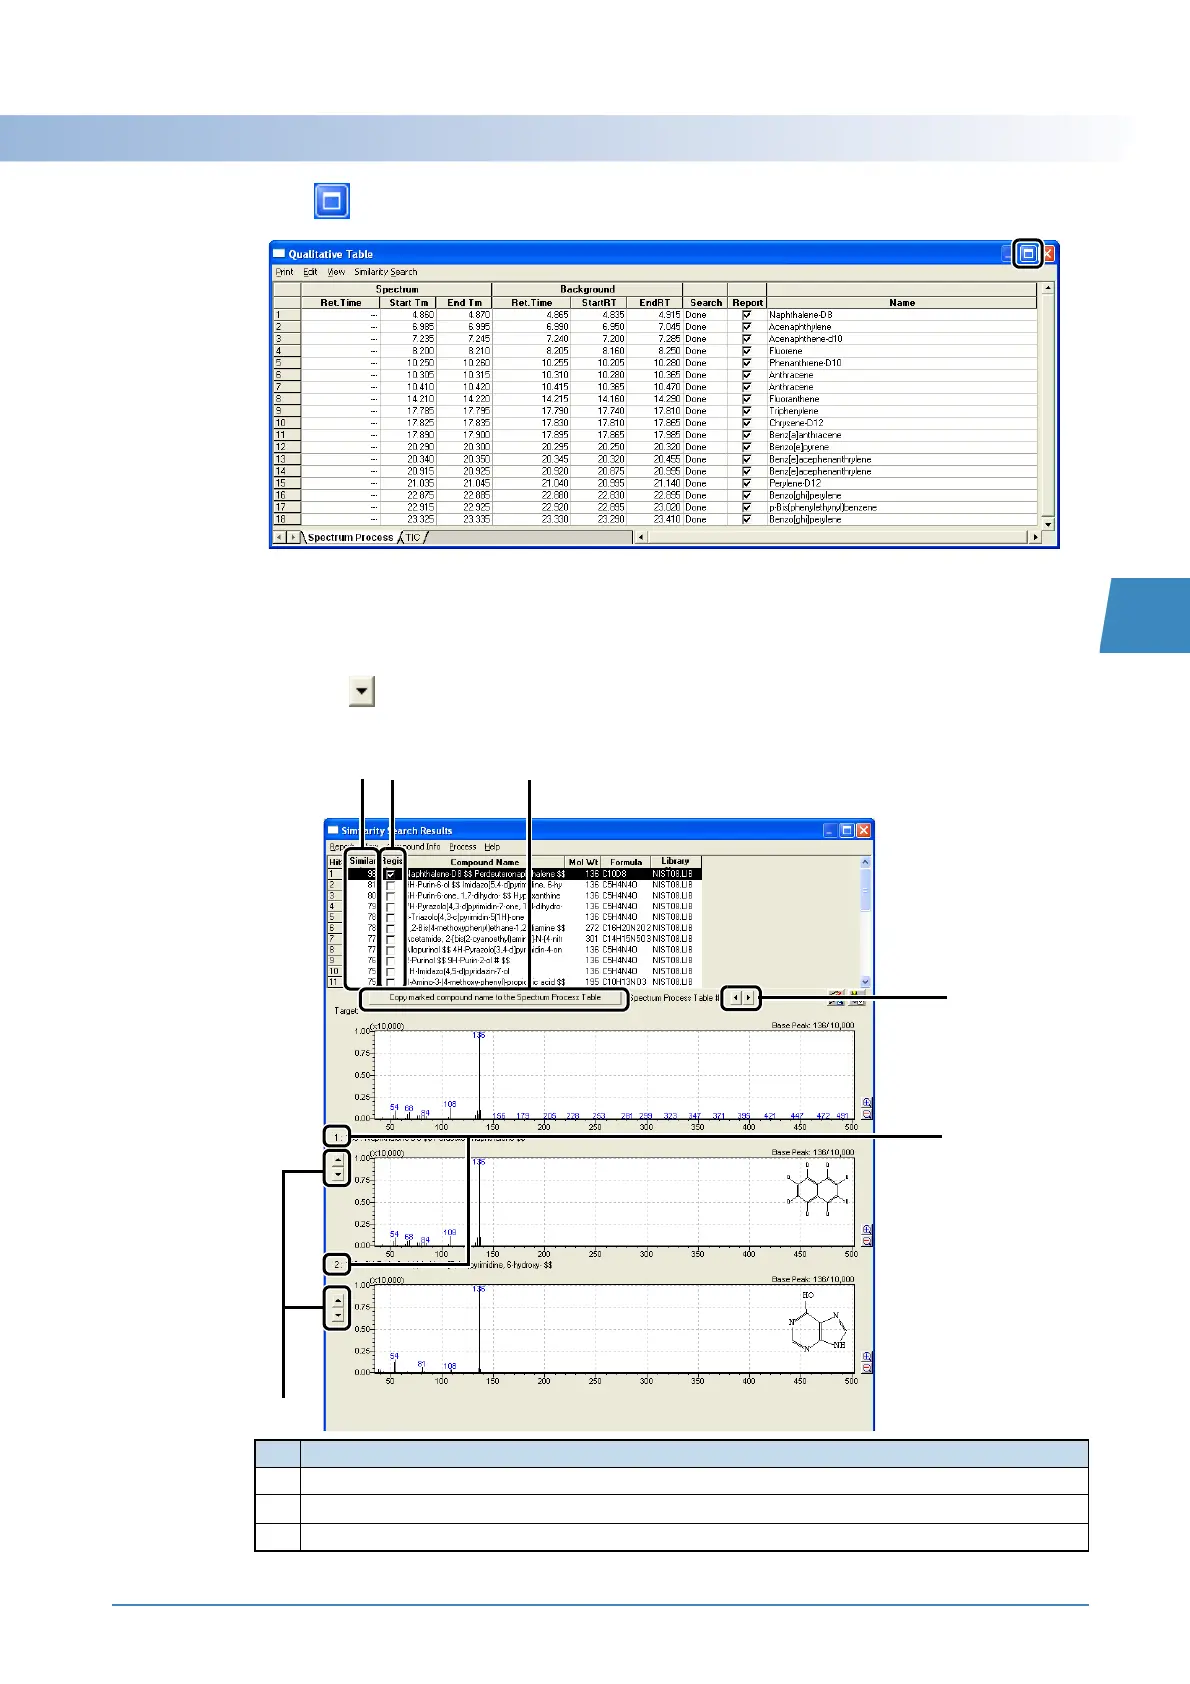
Click (Maximize).
3
Double-click the first row in the spectrum table.
The [Similarity Search Results] window opens.
4
Click the buttons on the left of the mass spectra as appropriate to double-check the
mass spectra for the compounds found.
No. Explanation
1
Similarity: The closer this value is to 100, the greater the similarity in mass spectra.
2
To enter a compound name in the spectrum table, select the box for the applicable compound.
3
Click to copy the selected compound names to the spectrum table.
1
5
4
23
6

 Loading...