Somat eDAQ
lite
78
I2773-4.4 en
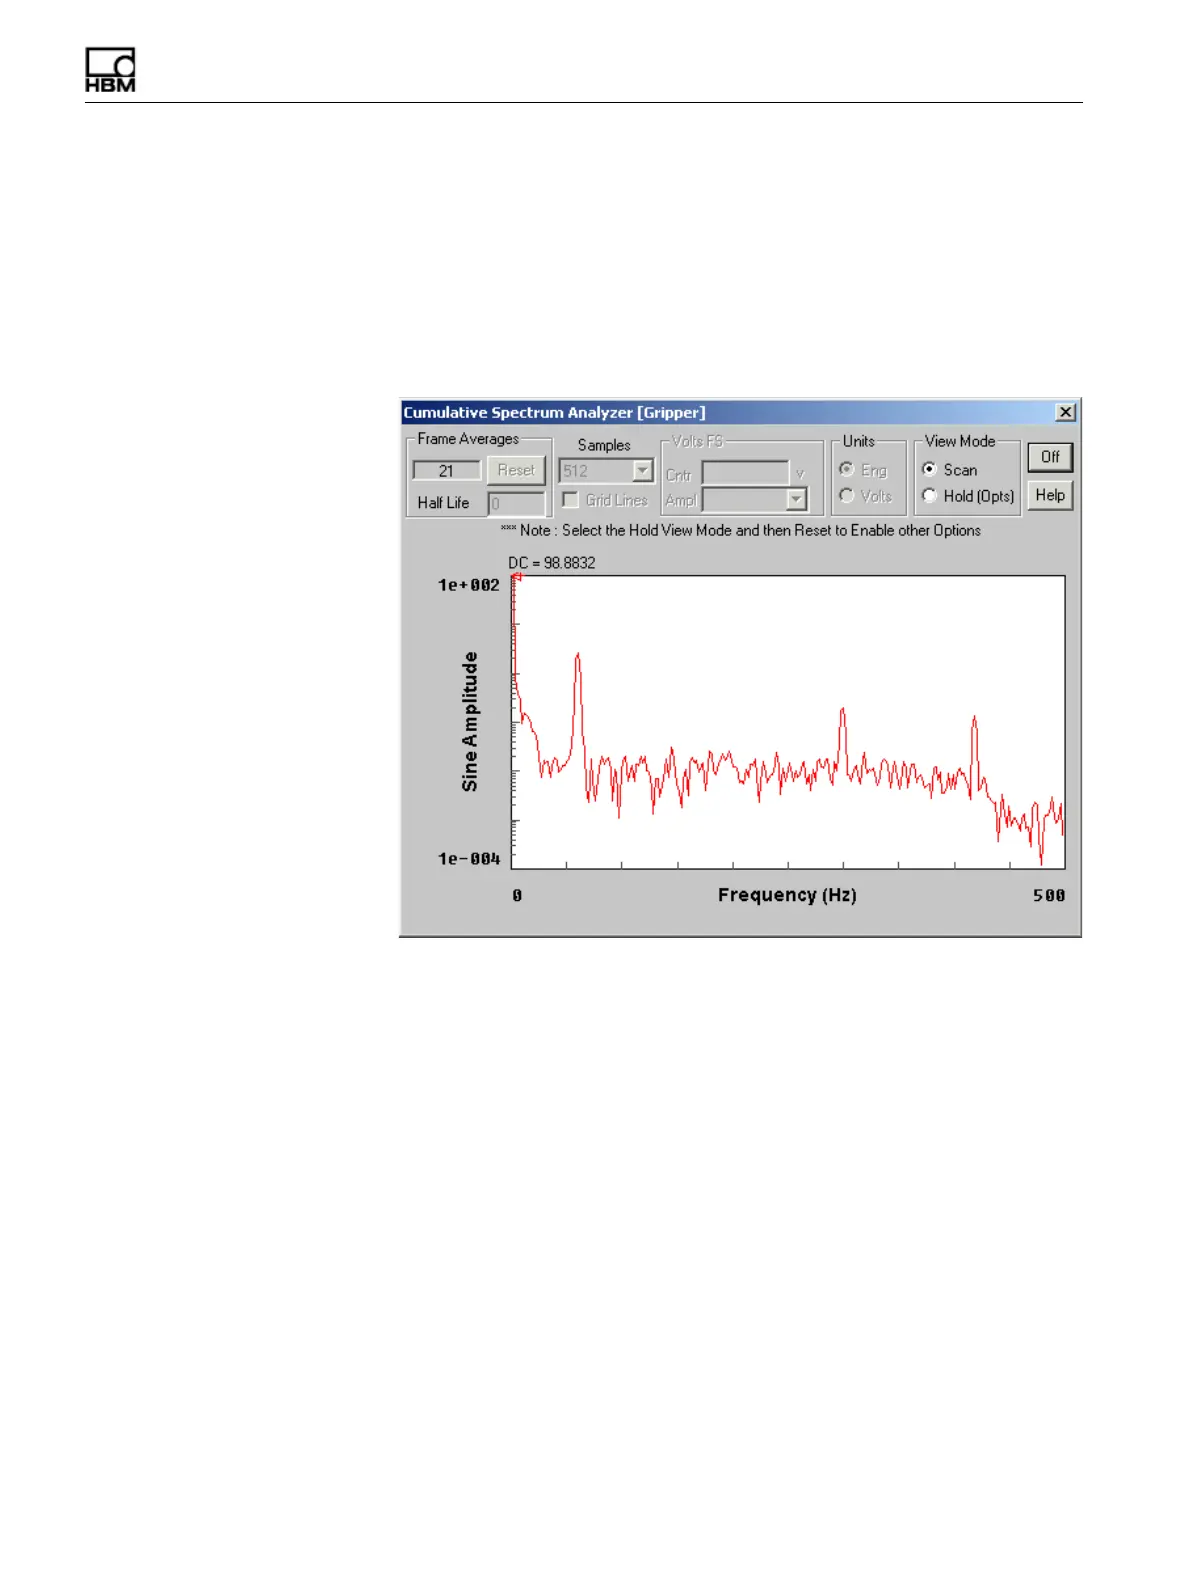
4.5.5 Spectrum Plot
The spectrum plot display shows the frequency content of the signal. TCE scales the
x-axis from 0 Hz to the Nyquist frequency (i.e., half the sample rate) and the log y-axis
to cover up to six decades. The data points are the approximate sine amplitude of the
signal components at each frequency. The data point at 0 Hz in the DC level of the
signal. The spectrum plot is available for a single channel at pre-initialization, as a
prerun option and as a run-time display. For more information on spectrum plot display
preferences, see “Scope and Spectrum Display” on page 56.
Figure 4-5:
A TCE spectrum plot as a prerun option display.
Samples
Select the desired number of samples used in the FFT algorithm to generate the
frequency spectrum.
Grid Lines
Select the grid lines option to add grid lines to the spectrum display. The grid lines
divide the x-axis into 10 equal parts and the y-axis on a log scale in decades.
Half Life
Select the desired half life value. The spectrum half life specifies the amount of old
data to combine with the newly acquired data. For example, if the half life is one, the
contribution of the old spectrum data is half of the contribution from the new data. If
the half life is ten, it takes ten new frames of data before the old data is at half its
influence. The default value is zero which results in no data accumulation. For
situations with stable signal content, a larger half life produces a display with fewer
fluctuations and a better representation of signal content.
HBM: public