Somat eDAQ
lite
80
I2773-4.4 en
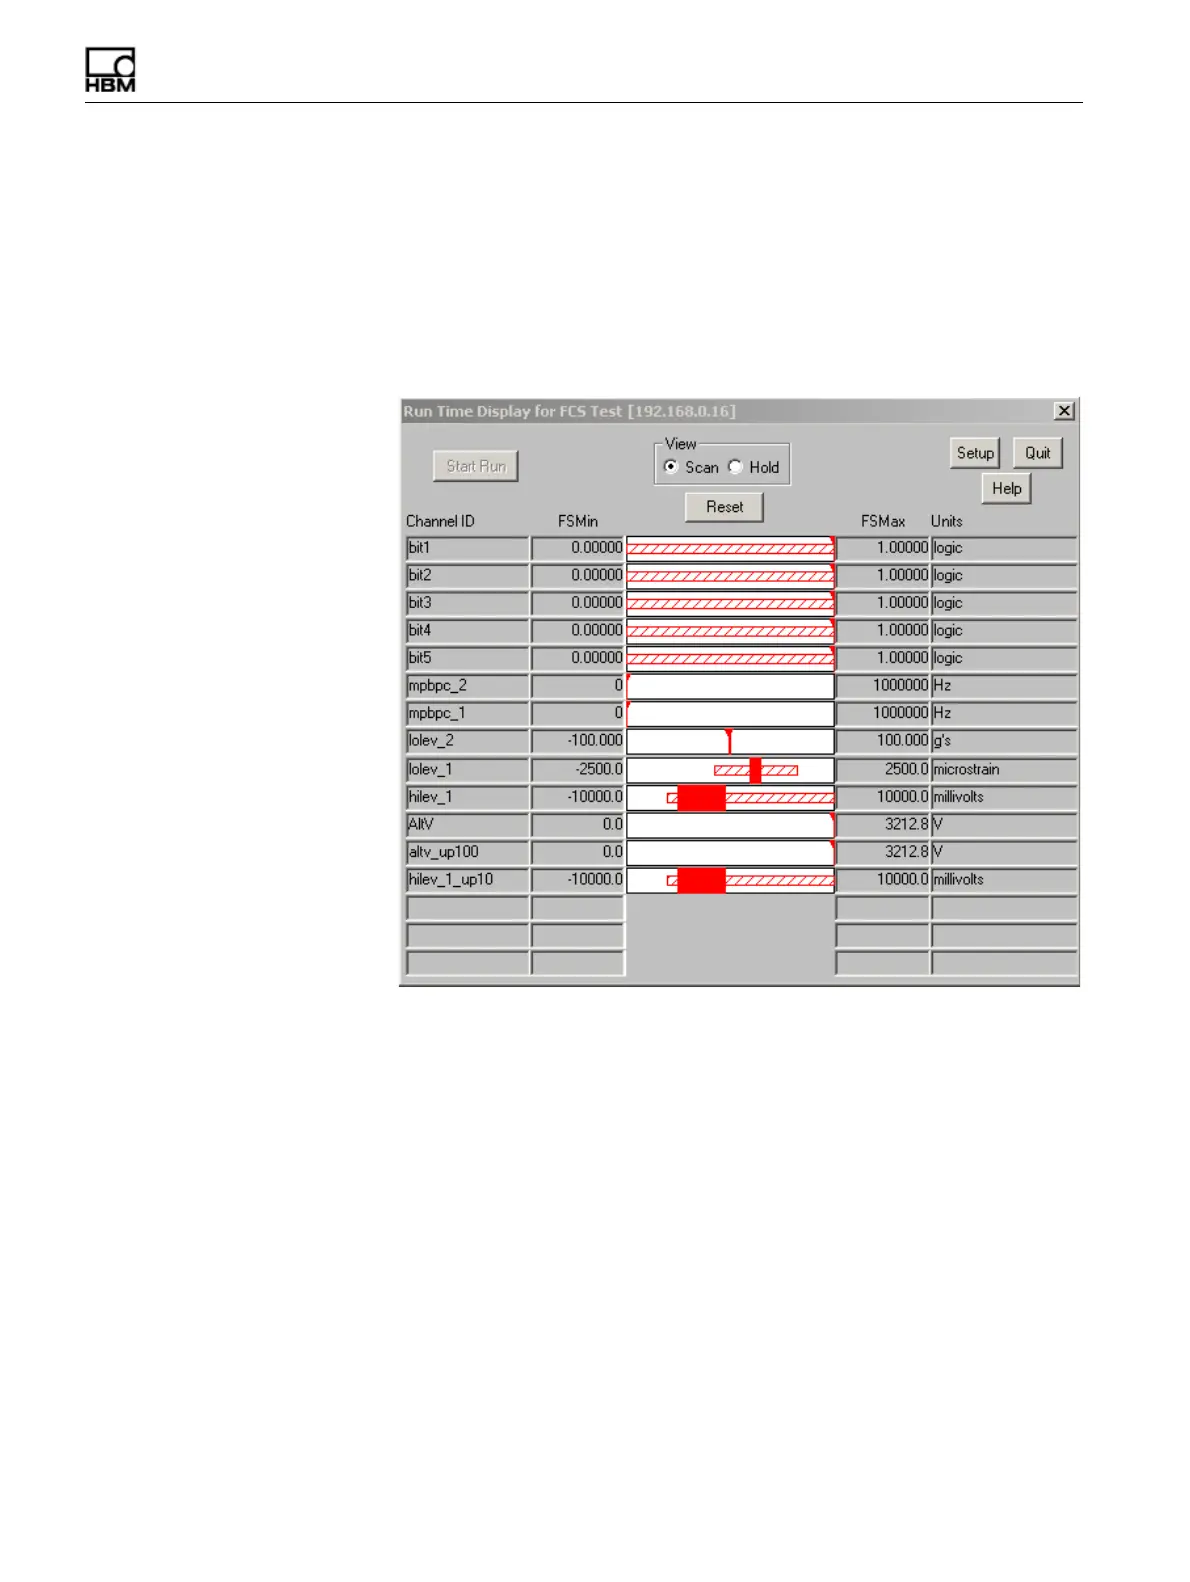
4.5.7 Bar Chart
The bar chart display uses solid horizontal bars to continuously show the most recent
minimum and maximum data values for up to 16 channels. TCE uses an arrow head
to point to the bar when the bar is very thin. The chart also uses cross-hatched
horizontal bars to show the overall minimum and maximum values since the start of
the display or the last reset. The FS min and max columns display the full-scale values
defined for the channel. The bar chart is available as a run-time display only. For more
information on bar chart display preferences, see “Run-Time Display” on page 56.
Figure 4-7:
A TCE bar chart run-time display.
Reset
Click the Reset button or use the ALT+R keyboard shortcut to reset the tracking and
display of the overall minimum and maximum values.
HBM: public