I2773-4.4 en
81
Somat eDAQ
lite
4.5.8 Strip Chart
The strip chart display shows the minimum and maximum readings for up to four
channels as a sequence of solid vertical bars along the x-axis. The chart displays up
to 400 most recent min-max readings. The strip chart is available as a run-time display
only. For more information on strip chart display preferences, see “Run-Time Display”
on page 56.
NOTE
The x-axis of the strip chart is not a linear time base. The display update period is
determined by the processing time required plus a built-in delay. Actions such as
changing the plot mode or placing the display on hold significantly affects the update
period. In steady-state operation, the x-axis is usually a good approximation of a linear
time base.
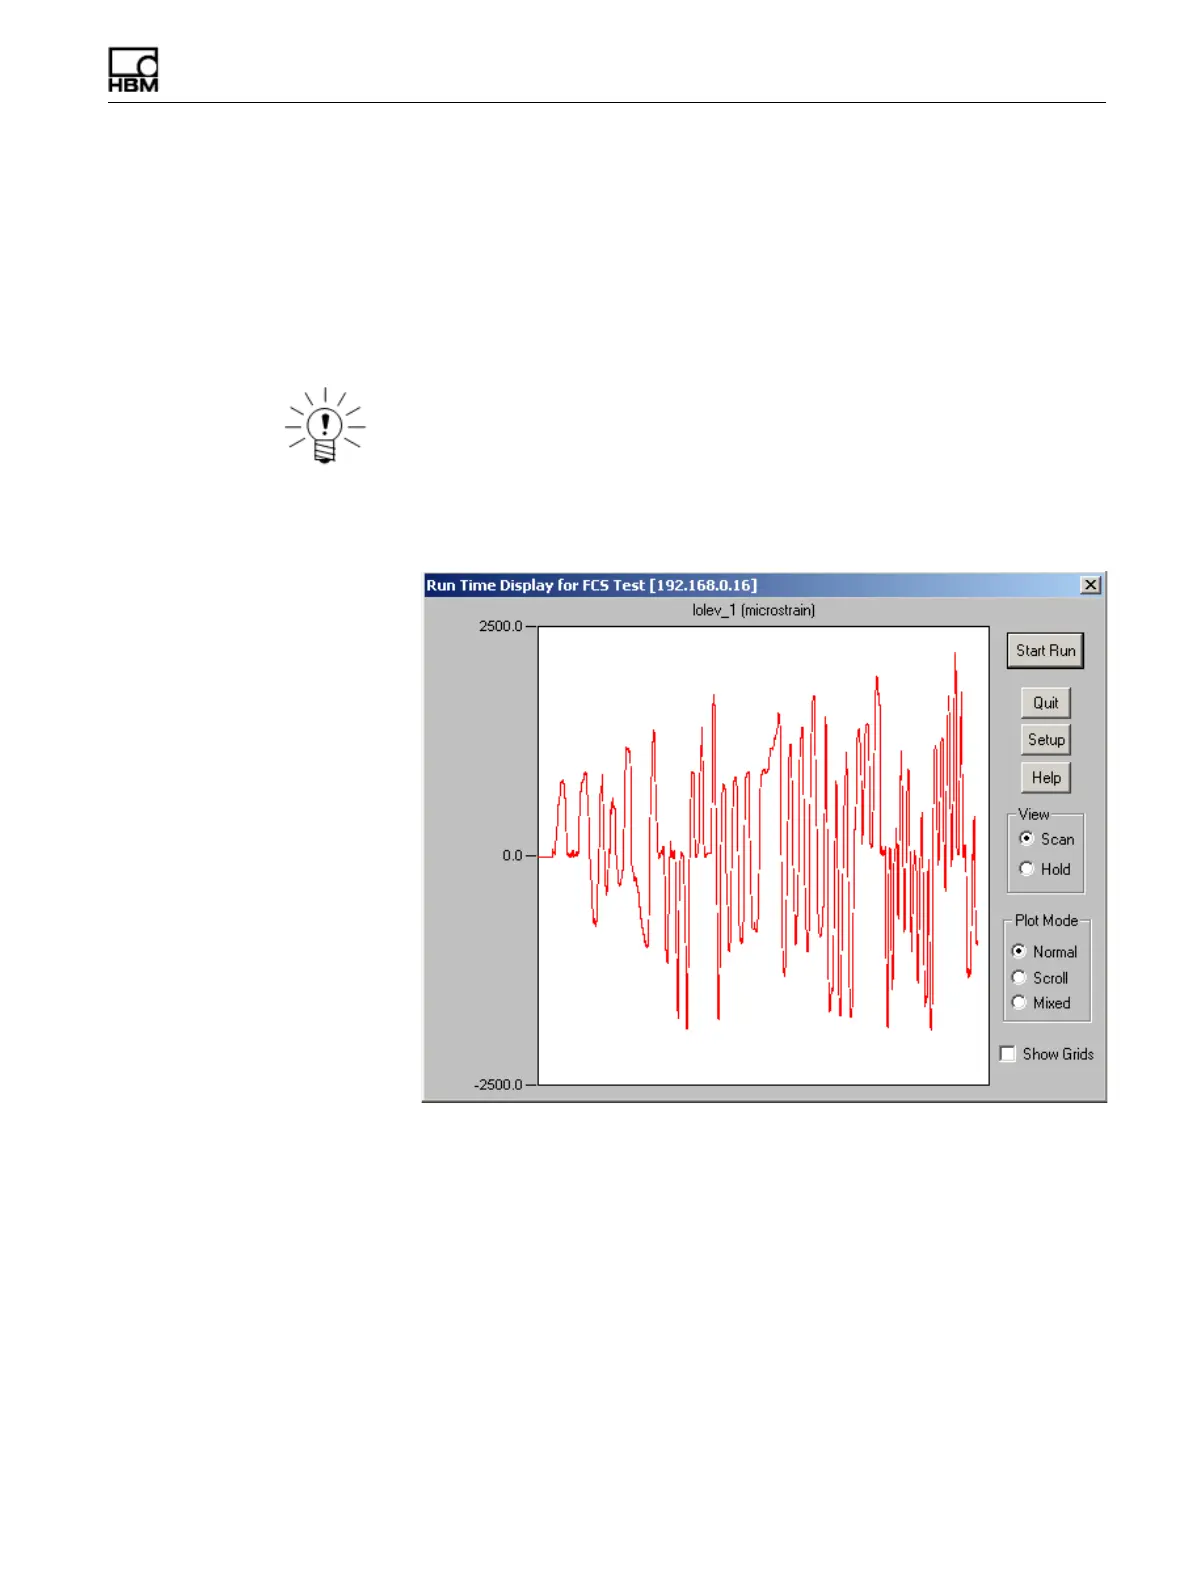
Figure 4-8:
A TCE strip chart run-time display.
Plot Mode
Select one of three strip chart plotting modes.
HBM: public