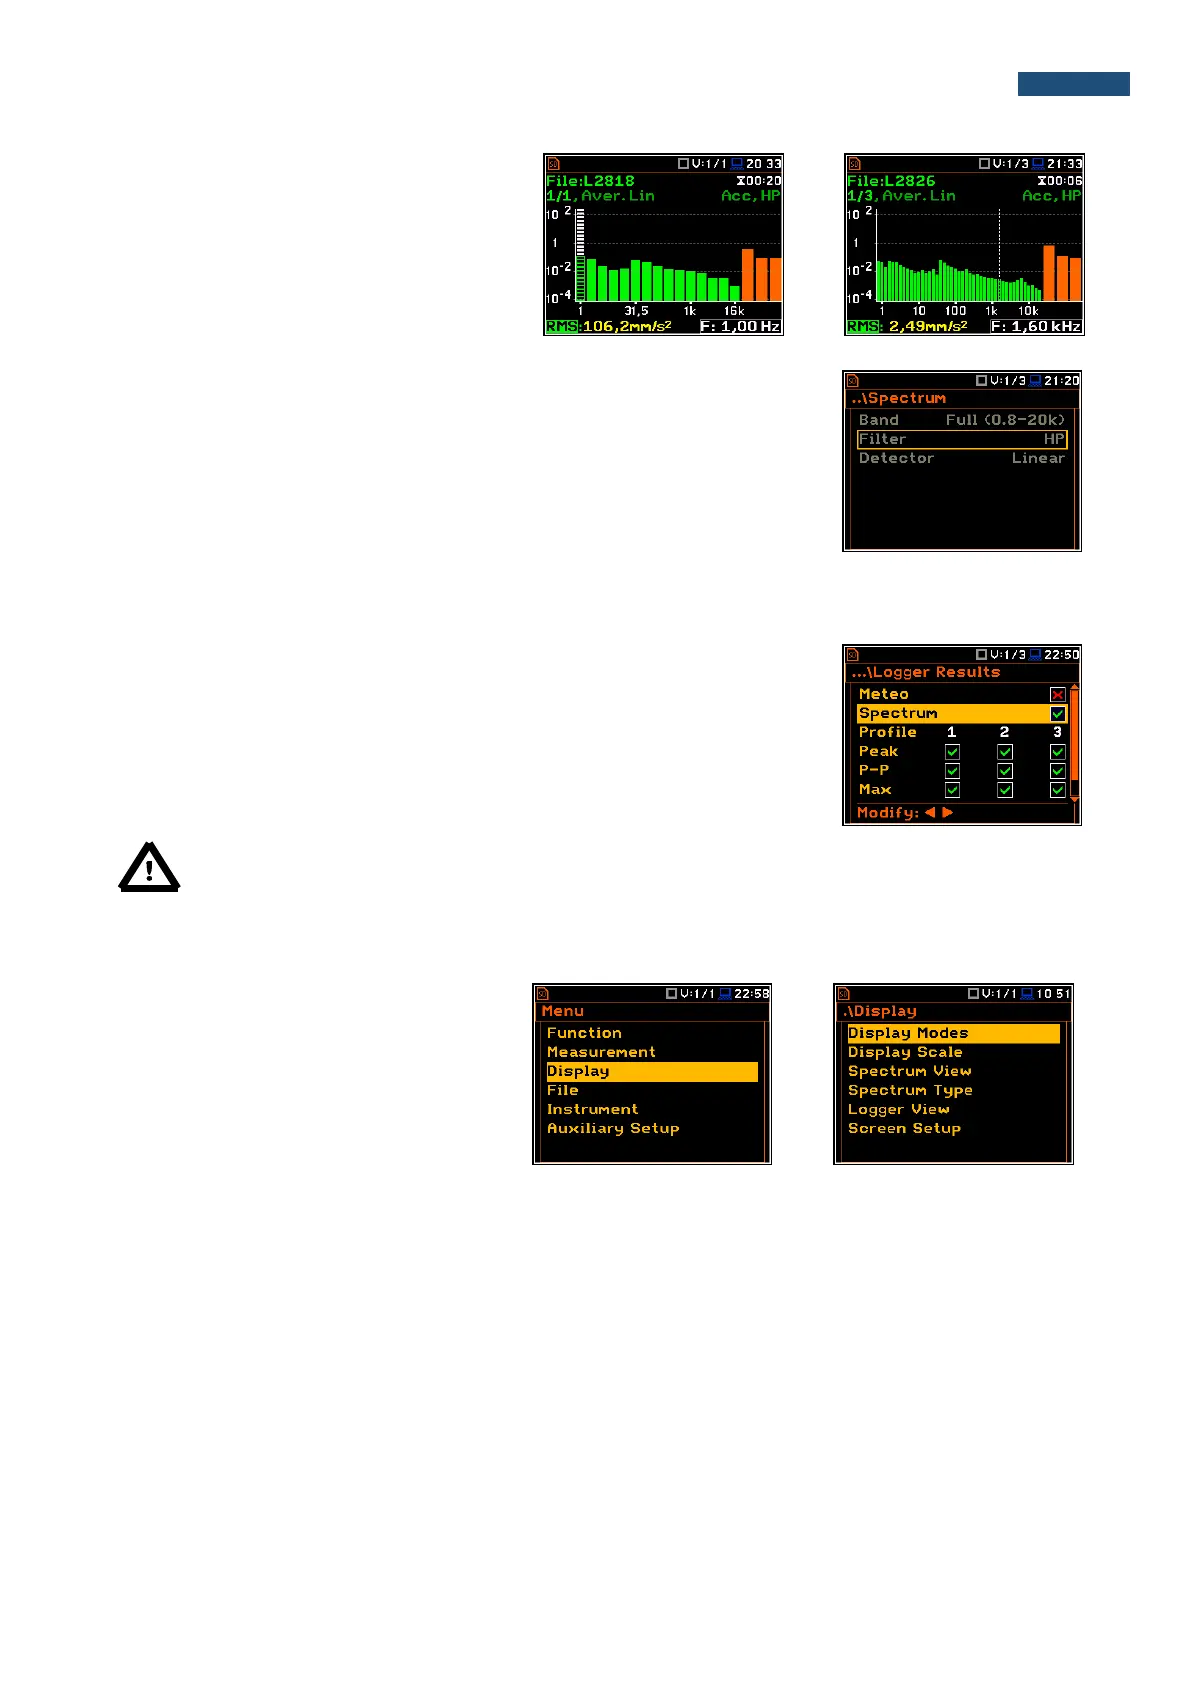
The Band position defines the applied band of
1/1 Octave or 1/3 Octave analysis:
• 1/1 Octave: Full (1-16k) - 15 filters with
centre frequencies 1 Hz ÷16 kHz,
• 1/3 Octave: Full (0.8-20k) - 45 filters with
centre frequencies 0.8 Hz ÷20 kHz.
Weighting filter
For vibration analysis one HP filter is used (type 1, according to the IEC 61672-
1 standard).
The characteristic of the filter is given in Appendix C.
RMS detector
Only one Linear detector is used
10.3. Saving the 1/1 or 1/3 Octave spectra as a time history – Logger Results
The RMS results from 1/1 Octave or 1/1 Octave analysis can be saved in the
logger file together with the logger results and with the step defined by the
Logger Step parameter (path: <Menu> / Measurement / Logging /
Logger Setup). The spectrum saving in the logger file is defined by activation
the Spectrum position in the Logger Results window by means of the ◄ or ►
push-buttons.
Note: The spectra are always saved together with the summary results with integration period step.
10.4. Setting up the 1/1 Octave and 1/3 Octave spectra view
The Display list is used for setting the
various parameters, which are mainly
dedicated for the control of the spectrum
view.
The following positions are used for setting
the presentation of the 1/1 Octave and
1/3 Octave results:
Display Modes enables the user to select the Spectrum view;
Display Scale enables the user to change the scale of the vertical and horizontal axis of the spectrum
plot, switch on or off the grid;
Spectrum View enables the user to choose the spectrum (Average, Instantaneous, Min, Max) to be
viewed;
Spectrum Type enables the user to change the viewed spectrum: Acceleration, Velocity or
Displacement.