The user can easily get into the FFT screen
from the spectrum view. It is necessary to
enter the function field (FFT) with the use of
▲ or ▼ push-buttons and press <ENTER>.
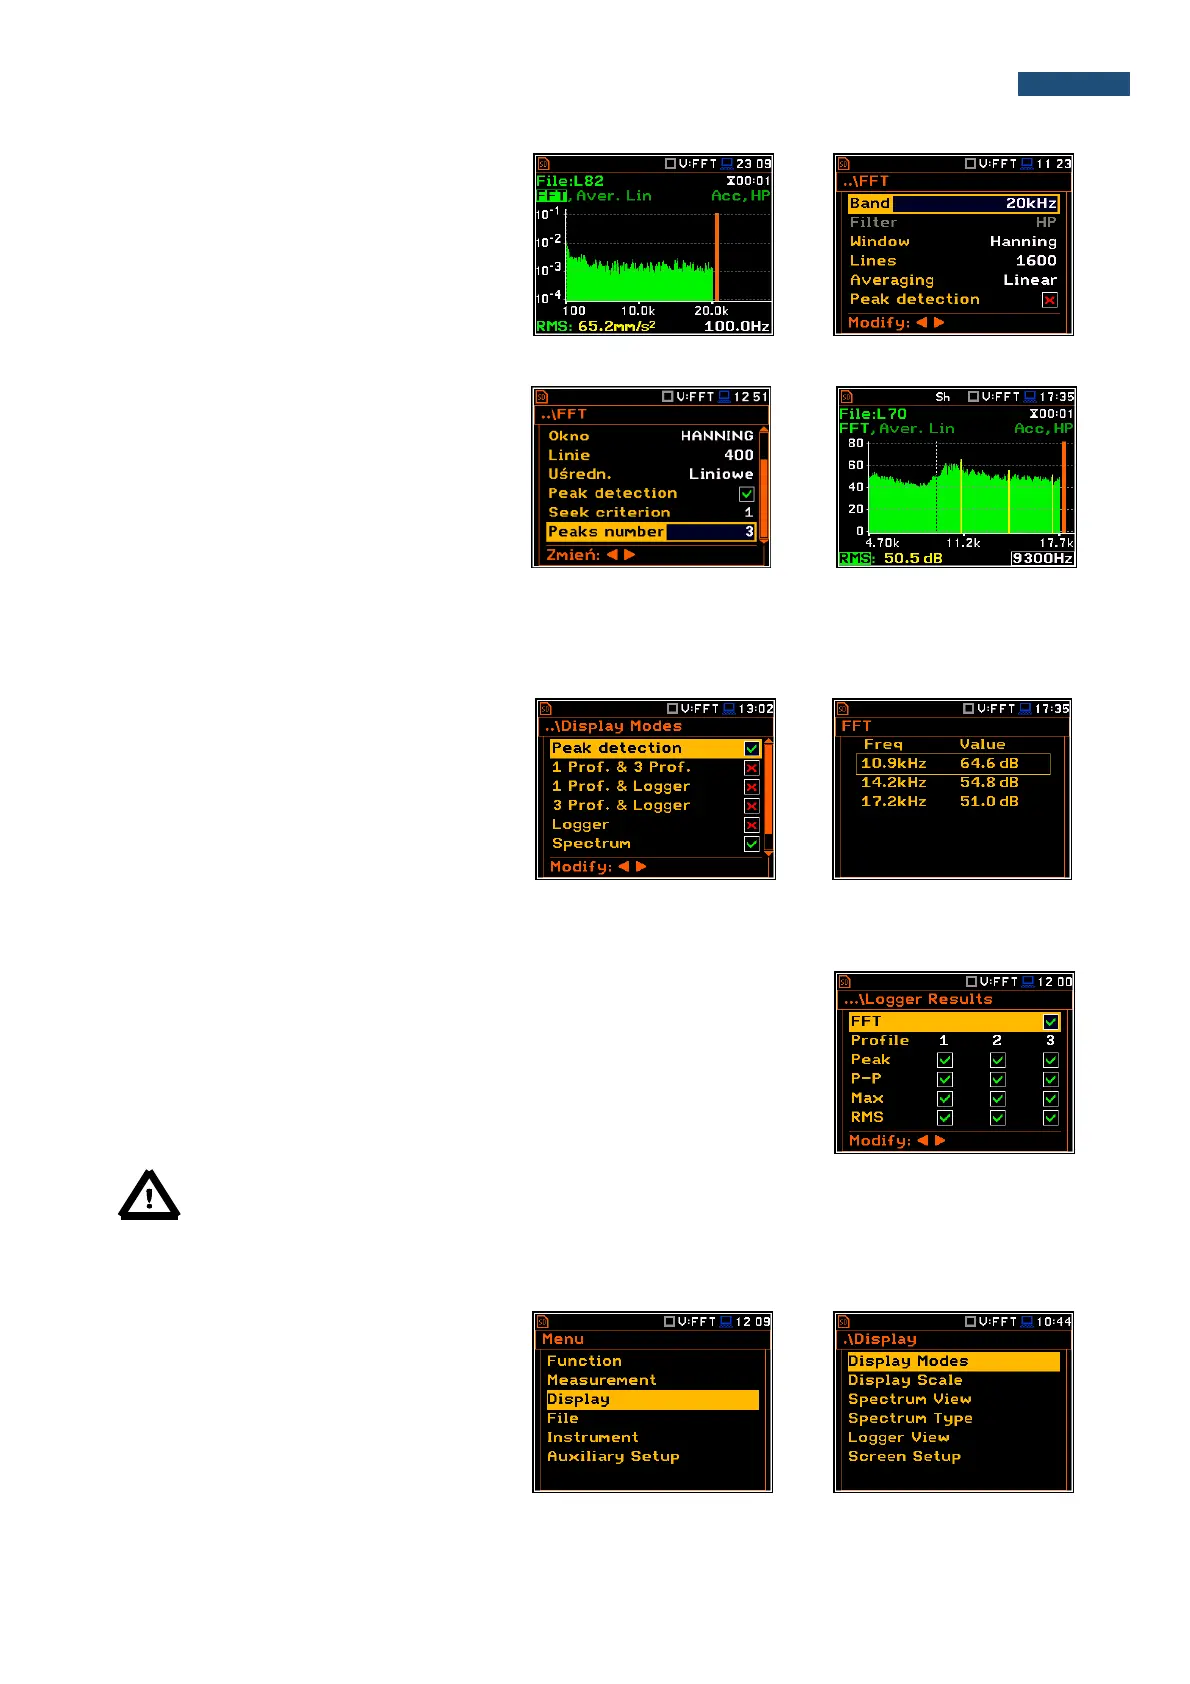
Peak detection
The peak detection is designed to find
peaks in the FFT spectrum. The algorithm
considers a given value of spectrum as a
peak, if it is larger than its predecessor at
60dB. The number of predecessors, who
must meet the condition of 60dB depends
on the depth of the search (Seek criterion).
The number of found peaks is not greater
than the value specified by the user in the
position Peaks number.
Found peaks are marked in yellow FFT
spectrum.
The user can activate additional view,
which includes a list of all the peaks found
in the form of a table. The first column
indicates the frequency of the peak and the
second its value.
11.3. Saving the FFT spectra as a time history - Logger Results
The FFT analysis results can be saved in the logger file together with the
logger results and with the step defined by the Logger Step parameter (path:
<Menu> / Measurement / Logging / Logger Setup). The spectrum saving in
the logger file is defined by activation the FFT position in the Logger Results
window by means of the ◄ or ► push-buttons.
Note: The spectra are always saved together with the summary results with integration period step.
11.4. Setting up the FFT spectra view
The Display list is used for setting the
various parameters, which are mainly
dedicated for the control of the spectrum
view.
The following positions are used for setting
the presentation of the FFT results:
Display Modes enables the user to select the Spectrum view;