The instrument operates as FFT analyser in a very similar way to the Level Meter. Moreover, FFT analysis is
performed in parallel with the Level Meter operations.
The results of FFT analysis (spectra) can be examined by the user on a display
in the Spectrum view. The availability of this mode can be switched on or off by
the user (path: <Menu> / Display / Display Modes).
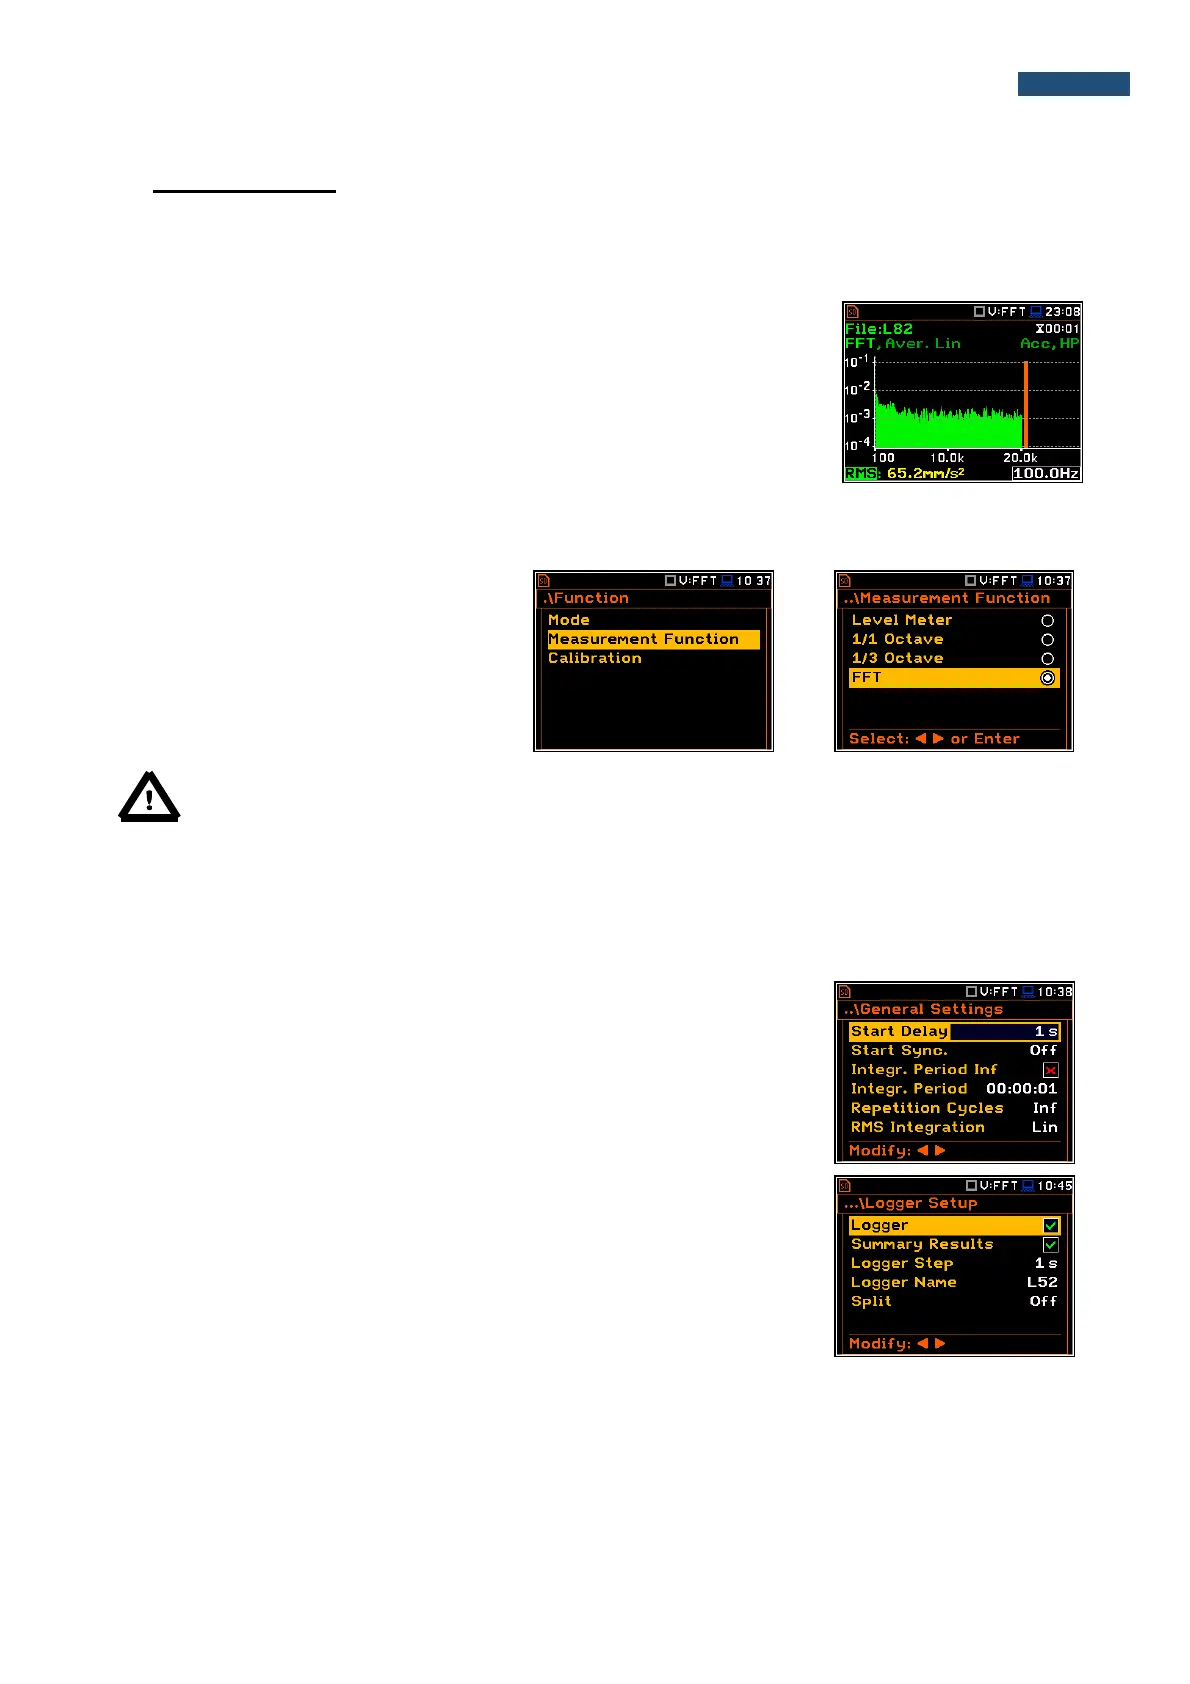
FFT spectra with the single Total overall value, measured with preselected
frequency weighting filters and windows, are presented in the Spectrum mode
if selected in the spectrum display menu. The read-out of the spectrum value
can be done using a vertical cursor.
11.1. Selection of FFT function
To select the FFT analysis function the user
should enter the Function list by pressing
the <Menu> push-button, then select the
Function text and press <ENTER>. In the
Measurement Function window select the
FFT position and press <ENTER>.
Note: It is not possible to change the current function during a measurement.
In this case, the instrument displays for about 2 seconds the text: “Measurement in Progress”.
To change the current function, the measurement must be stopped!
11.2. Configururing FFT analyser
Execution of the FFT analysis depends on a certain number of parameters, which can be set in the different
windows of the Measurement list. Some parameters are fixed: filter (HP) and the measurement range.
The FFT analysis is performed based on the parameters selected in the
General Settings list of Measurement menu: Integration Period and
Repetition Cycles.
The spectra are stored as main results in a results file with the same step
(Integr. Period) as the other main results, measured by the Level Meter
function.
The user can switch on or off the history of spectra recording in the logger file
(path: <Menu> / Measurement / Logging / Logger Results / Spectrum:
). If
spectra history is switched on, the spectra will be logged also with the step,
defined by the Logger Step parameter (path: <Menu> / Measurement /
Logging / Logger Setup / Logger Step).