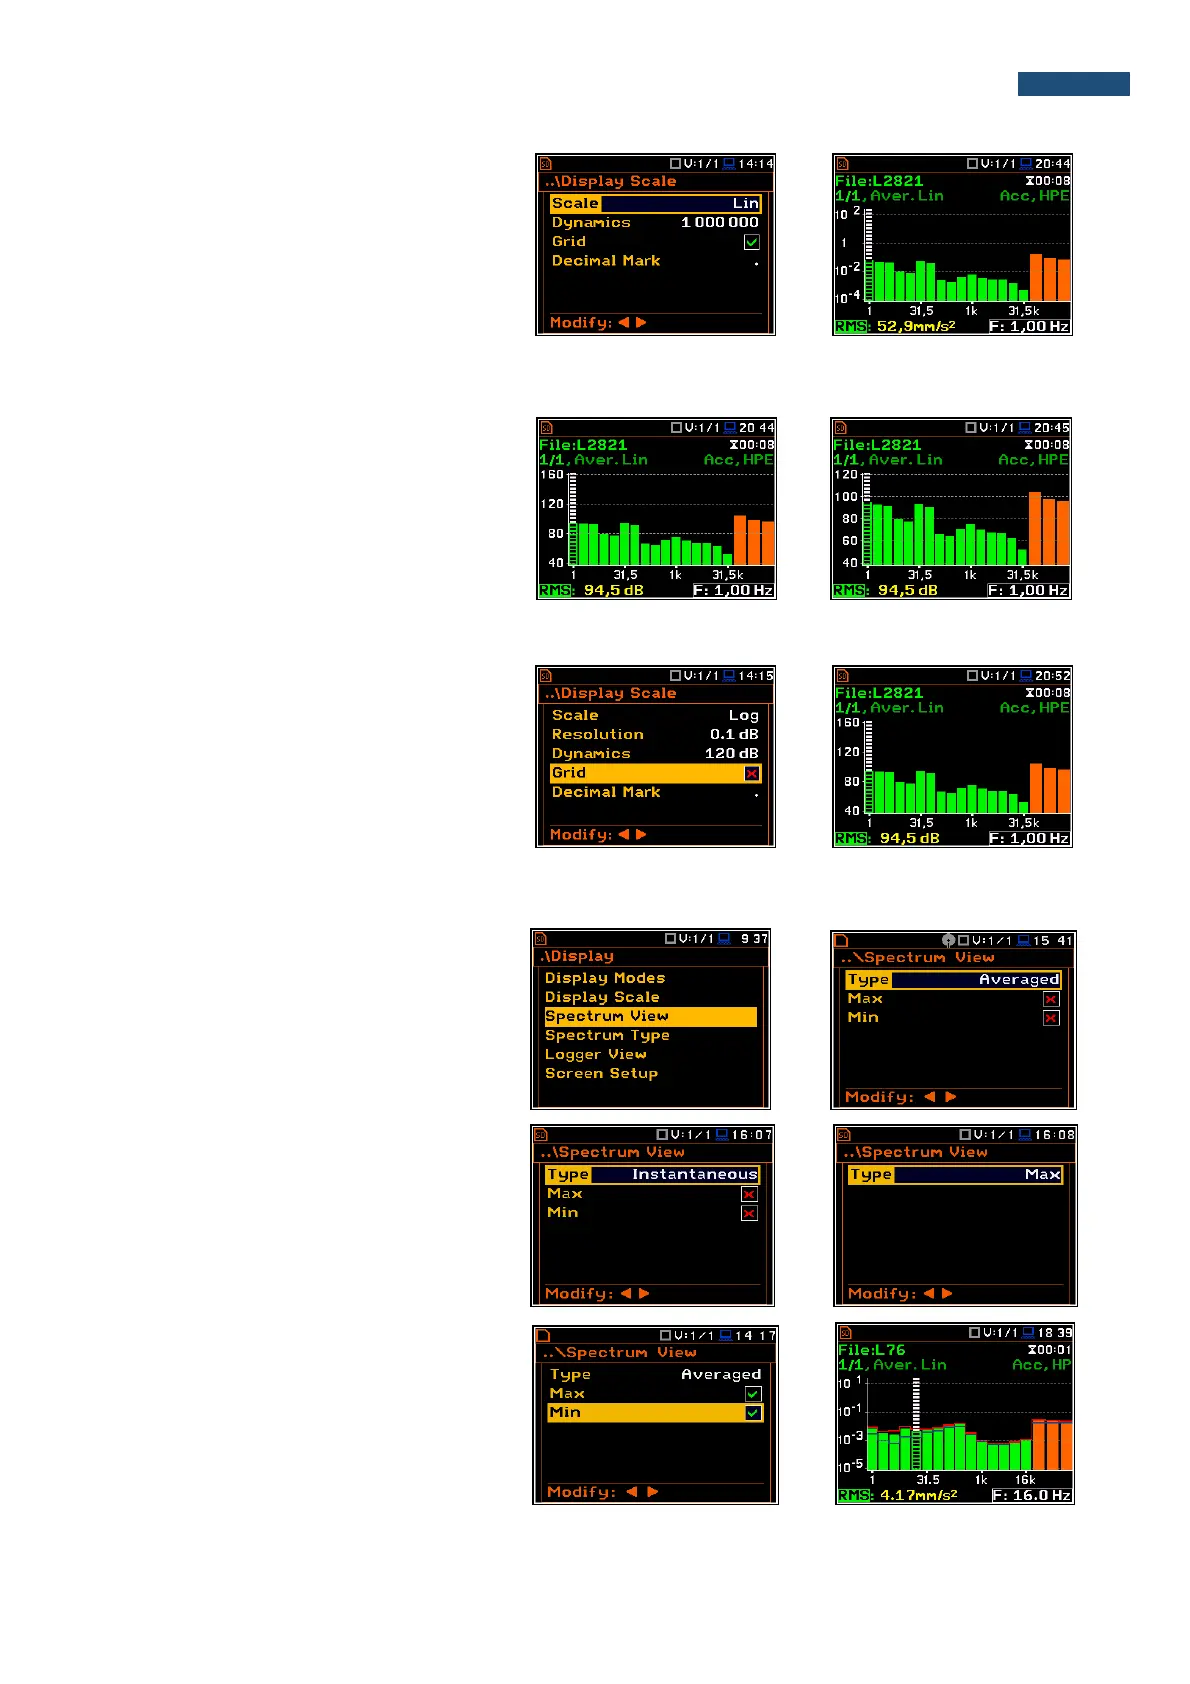
Scale of results presentation
The Scale position defines the units of
results: Lin (linear) and Log (logarithmic).
In case of Log the graphical presentation is
given in the logarithmic scale and the
measurement results are expressed in
decibels (the result is related to the values
set in the Reference Levels window (path:
<Menu> / Auxiliary Setup /
Reference Levels).
Scaling the plot vertical axis
The Dynamic position enables the user to
select the required dynamic range scaling
of the spectrum plot. It is possible to select
the range from the set: 10dB, 20dB, 40dB,
80dB, 100dB and 120dB.
The presented views of the same octave
spectrum are made for the dynamics of the
axis 40 and 80 dB.
Switching the grid on/off
The Grid enables the user to switch on or
off the horizontal grid lines in the spectrum
view.
10.4.3. Selection of the spectra to be viewed - Spectrum View
In the Spectrum View window, the user
can select the different spectra to be visible
on the display. In the Spectrum View
window the following spectrum types may
be selected: Averaged, Instantaneous,
Max or Min.
In the Type position the user may choose
the following different spectrum type to be
presented on the display in the graphical
view modes: Averaged, Instantaneous,
Max and Min.
When the Averaged or Instantaneous
spectrum is selected, the user can
additionally switch on or off the
presentation of the Max and/or Min values
for every displayed spectrum band by
switching the Max or Min parameters on.