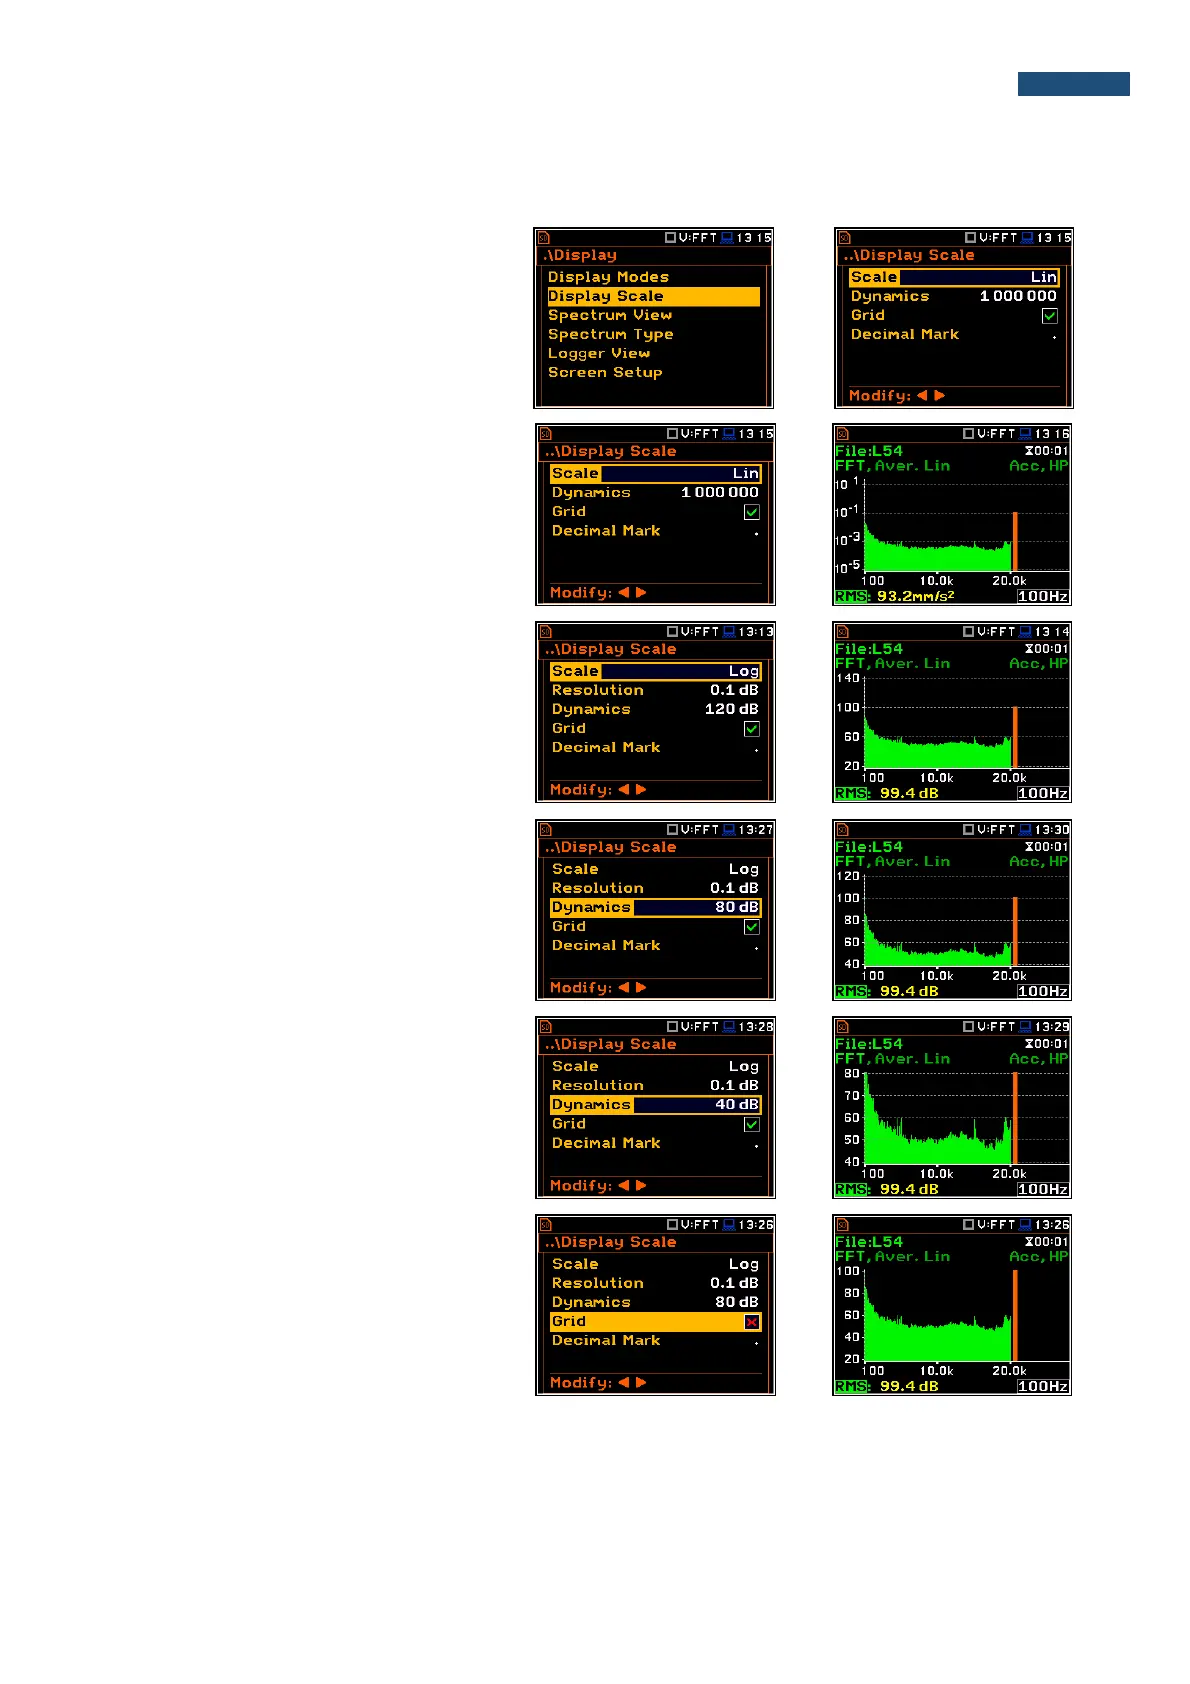
11.4.2. Setting up the scale of spectrum plot - Scale
The Display Scale sub-list enables the
user to change the scale of the spectrum
plot, switch the grid on or off.
The user can also define Decimal Mark
(point or comma) and number of digits after
the decimal mark (Resolution) for
logarithmic values.
Scale of results presentation
The Scale position defines the units of
results: Lin (linear) and Log (logarithmic).
In case of Log the graphical presentation is
given in the logarithmic scale and the
measurement results are expressed in
decibels (the result is related to the values
set in the Reference Levels window (path:
<Menu> / Auxiliary Setup /
Reference Levels).
Scaling the plot vertical axis
The Dynamic position enables the user to
select the required dynamic range scaling
of the spectrum plot. It is possible to select
the range from the set: 10dB, 20dB, 40dB,
80dB, 100dB and 120dB.
The presented views of the same octave
spectrum are made for the dynamics of the
axis 40 and 80 dB.
Switching the grid on/off
The Grid enables the user to switch on or
off the horizontal grid lines in the spectrum
view.