10.4.1. Presentation of 1/1 Octave and 1/3 Octave spectra
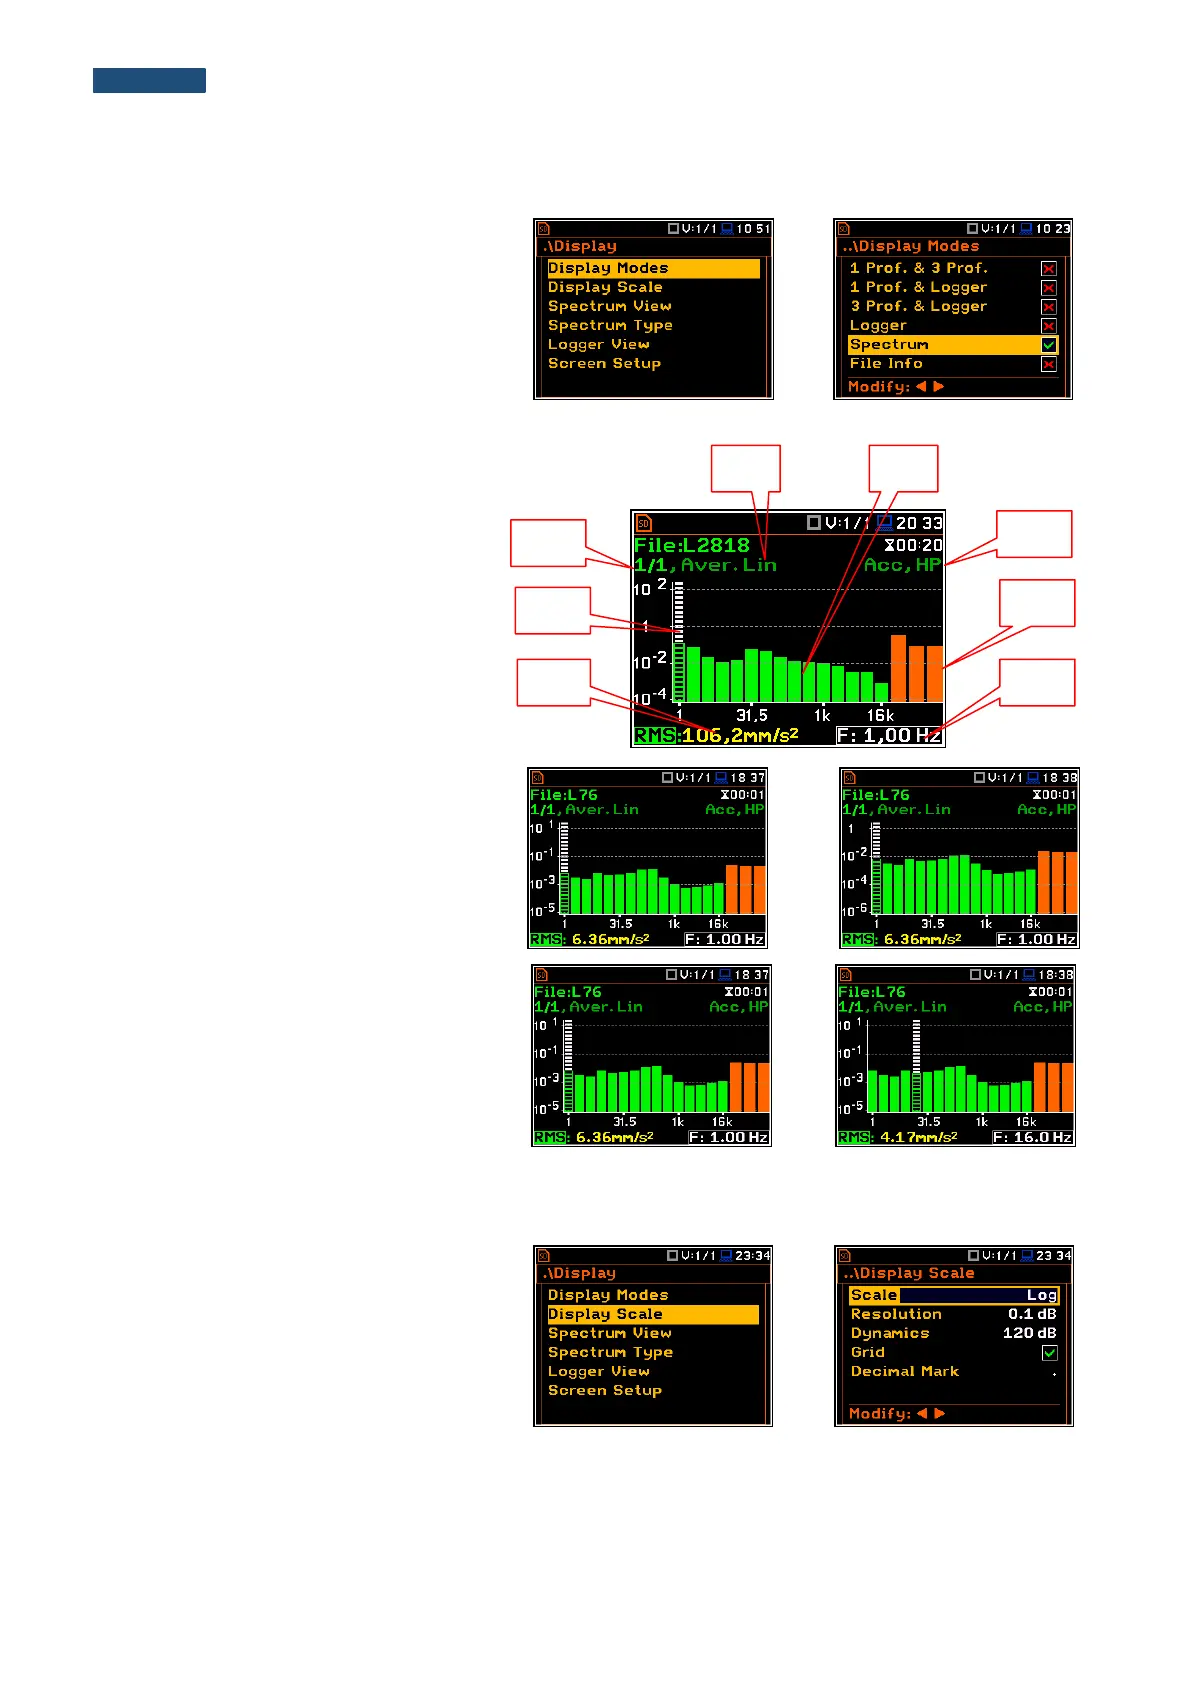
The Spectrum position of the
Display Modes list becomes available for
the 1/1 Octave and 1/3 Octave functions
and enables the user to switch on or off the
spectrum view.
Fields description of the Spectrum view
1. Type of spectrum
2. Cursor position
3. Value for the cursor position
4. Averaging used
5. Spectrum plot
6. Frequency weighting filter used
7. Total values
8. Central frequency for the cursor position
The user can shift the Y-axis during the
spectrum view after pressing the <Shift>
and ▲ (or <Shift> and ▼) push-buttons.
The user can change the cursor position by
means of the ◄ or ► push-buttons. The
user can change quickly to the first or last
spectrum line by simultaneously pressing
the ◄ or ► buttons with <Shift>.
The band central frequency and the
appropriate value are presented in the line
below the plot.
10.4.2. Setting up the scale of the spectrum plot - Scale
The Display Scale sub-list enables the
user to change the scale of the spectrum
plot, switch the grid on or off.
The user can also define Decimal Mark
(point or comma) and number of digits after
the decimal mark (Resolution) for
logarithmic values.