Display Scale enables the user to change the scale of the vertical and horizontal axis of the spectrum
plot, switch on or off the grid;
Spectrum View enables the user to choose the spectrum (Average, Instantaneous, Min, Max) to be
viewed;
Spectrum Type enables the user to change the viewed spectrum: Acceleration, Velocity or
Displacement.
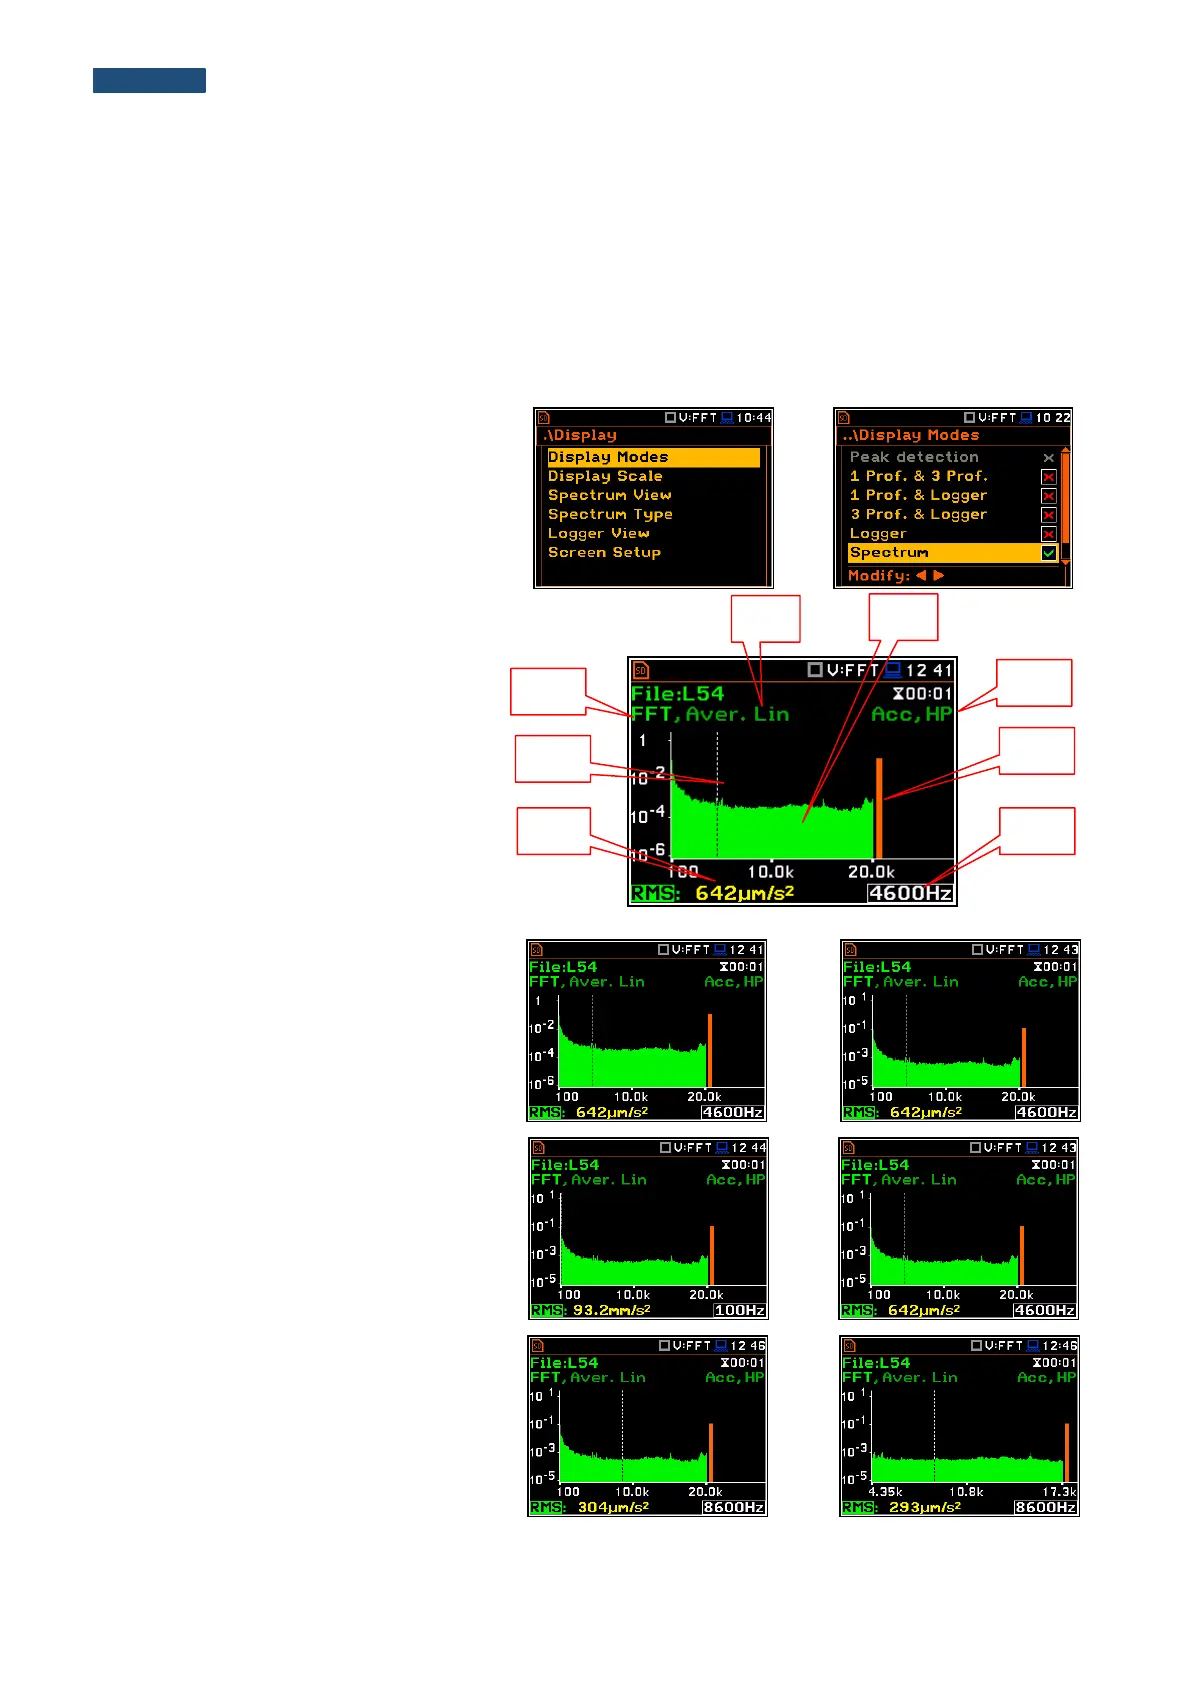
11.4.1. Presentation of FFT spectra
The Spectrum position of the
Display Modes list becomes available in
the FFT function and enables the user to
switch on or off the spectrum view.
Fields description of the Spectrum view
1. Type of spectrum
2. Cursor position
3. Value for the cursor position
4. Averaging used
5. Spectrum plot
6. Frequency weighting filter used
7. Total value
8. Central frequency for the cursor position
The user can shift the Y-axis during the
spectrum presentation after pressing the
<Shift> and ▲ (or the <Shift> and ▼)
push-buttons.
The user can change the cursor position by
means of the ◄ or ► push-buttons.
The frequency and appropriate value are
presented in the line below the plot.
The user can zoom in/out the frequency
scale at the cursor position by means of the
◄ or ► push-buttons, pressed with
<Shift>.