105 Maintenance and Service 083730300A DCN8101
5.2 PREDICTING DIAGNOSTICS
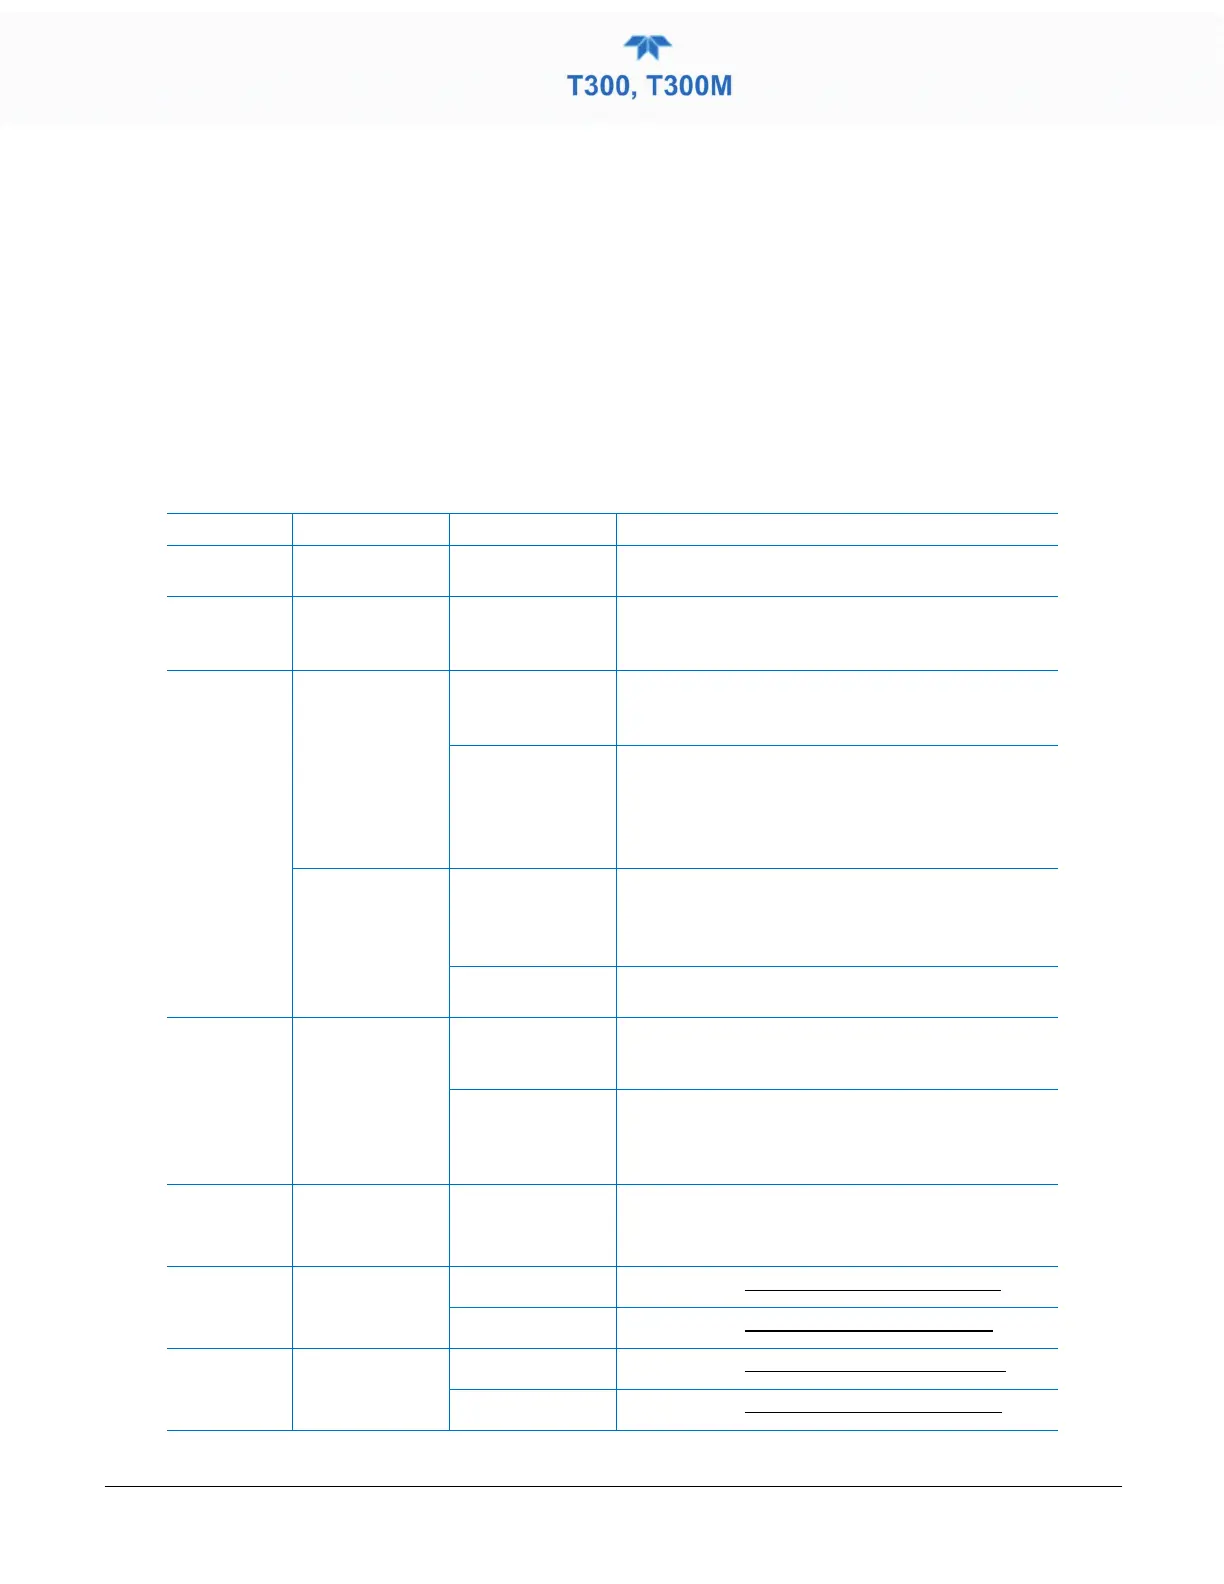
These Functions can be used to predict failures by looking at how their values change
over time. Initially it may be useful to compare the state of these functions to the values
recorded on the printed record of the Final Test and Validation Data Sheet for your
instrument. Table 5-3 can be used as a basis for taking action as these values change with
time. The Data Logger (internal data acquisition system or DAS) is a convenient way to
record and track these changes (Section 2.5.1). Use NumaView™ Remote to download
and review this data from a remote location.
Table 5-3. Predictive Uses for Dashboard Functions
FUNCTION CONDITION BEHAVIOR INTERPRETATION
STABILITY
Zero Cal Increasing
• Pneumatic Leaks – instrument & sample system
•
MEAS
DETECTOR
Zero Cal Decreasing
•
• Detector deteriorating
•
Optics getting dirty or contaminated
MR RATIO
Zero Cal
Increasing
• Source Aging
• Detector deteriorating
•
Contaminated zero gas (H
2
O)
Decreasing
• Source Aging
• Detector deteriorating
• GFC Wheel Leaking
• Pneumatic Leaks
•
Contaminated zero gas (CO)
Span Cal
Increasing
•
• Pneumatic Leaks – instrument & sample system
• Calibration system deteriorating
•
Decreasing
• Source Aging
•
Calibration system deteriorating
SAMPLE
PRESSURE
Sample
Increasing > 1”
• Pneumatic Leak between sample inlet and
Sample Cell
•
Change in sampling manifold
Decreasing > 1”
• Dirty particulate filter
• Pneumatic obstruction between sample inlet and
Sample Cell
• Obstruction in sampling manifold
PHT DRIVE
Any, but with
Bench Temp at
48°C
Increasing
• Mechanical Connection between IR-Detector and
Sample Cell deteriorating
• IR-Photodetector deteriorating
OFFSET
Zero Cal
Increasing
• See above, MR Ratio - Zero Cal Decreasing
Decreasing
•
See above, MR Ratio - Zero Cal Increasing
SLOPE
Span Cal
Increasing
• See above, MR Ratio - Span Cal Decreasing
Decreasing
• See above, MR Ratio – Span Cal Increasing
 Loading...