Lab 7: Control Peripherals
C2000 Microcontroller Workshop - Control Peripherals 7 - 47
9. Open and setup a graph to plot a 50-point window of the ADC results buffer.
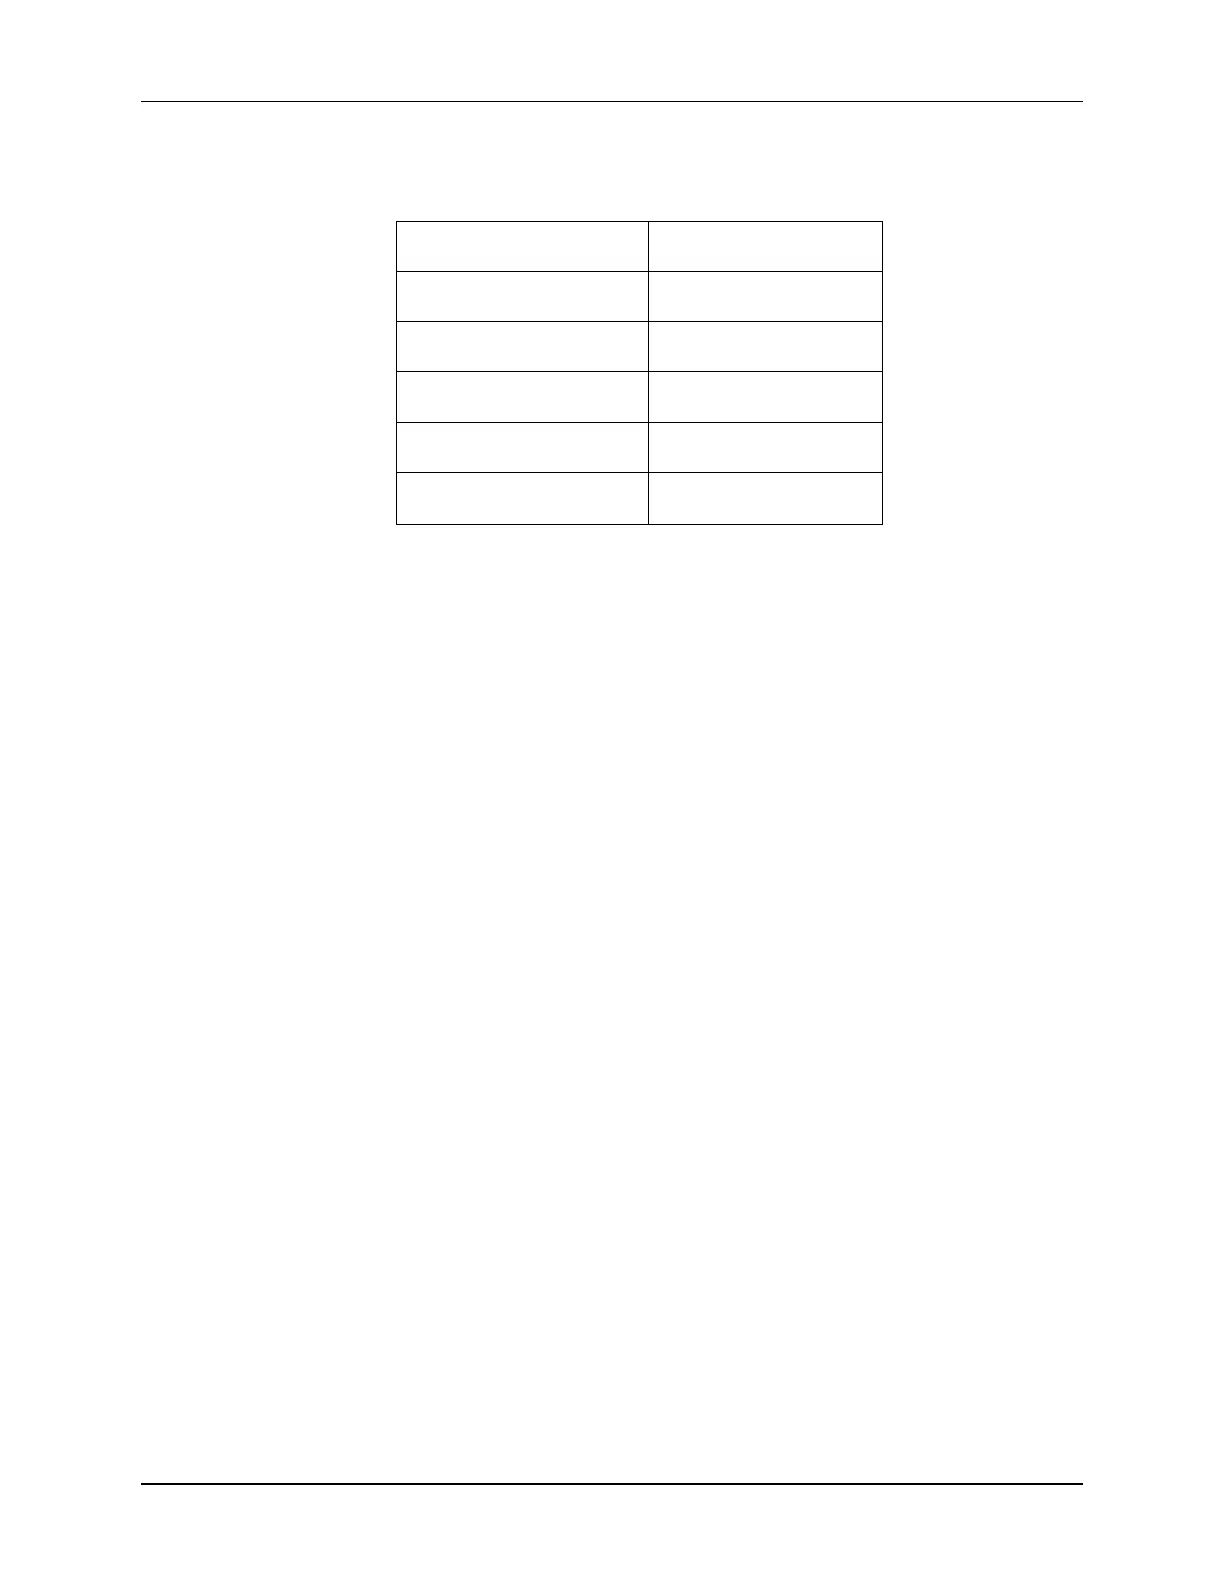
Click: Tools Graph Single Time and set the following values:
Acquisition Buffer Size 50
DSP Data Type 16-bit unsigned integer
Sampling Rate (Hz) 50000
Start Address AdcBuf
Display Data Size 50
Time Display Unit
µs
Select OK to save the graph options.
10. The graphical display should show the generated 2 kHz, 25% duty cycle symmetric
PWM waveform. The period of a 2 kHz signal is 500 µs. You can confirm this by
measuring the period of the waveform using the “measurement marker mode” graph
feature. Disable continuous refresh for the graph before taking the measurements. In the
graph window toolbar, left-click on the ruler icon with the red arrow. Note when you
hover your mouse over the icon, it will show “Toggle Measurement Marker
Mode”. Move the mouse to the first measurement position and left-click. Again, left-
click on the Toggle Measurement Marker Mode icon. Move the mouse to the
second measurement position and left-click. The graph will automatically calculate the
difference between the two values taken over a complete waveform period. When done,
clear the measurement points by right-clicking on the graph and select Remove All
Measurement Marks. Then enable continuous refresh for the graph.
Frequency Domain Graphing Feature of Code Composer Studio
11. Code Composer Studio also has the ability to make frequency domain plots. It does this
by using the PC to perform a Fast Fourier Transform (FFT) of the DSP data. Let's make
a frequency domain plot of the contents in the ADC results buffer (i.e. the PWM
waveform).
Click: Tools Graph FFT Magnitude and set the following values: