Chapter 6: Basic Function Graphing 117
06BASFUN.DOC TI-89/TI-92 Plus: Basic Function Graphing (English) Susan Gullord Revised: 02/23/01 4:09 PM Printed: 02/23/01 4:18 PM Page 117 of 22
From the Graph screen, press
…
.
The trace cursor appears on the function, at the middle
x
value on
the screen. The cursor’s coordinates are displayed at the bottom of
the screen.
If multiple functions are graphed, the trace cursor appears on the
lowest-numbered function selected in the Y= Editor. The function
number is shown in the upper right part of the screen.
To move the trace cursor: Do this:
To the previous or next plotted point Press
A
or
B
.
pproximately 5 plotted points
(it may be more or less than 5,
depending on the
xres
Window variable)
Press
2A
or
2B
.
To a specified
x
value on the function Type the
x
value and
press
¸
.
The trace cursor moves only from plotted point to plotted point
along the function, not from pixel to pixel.
Each displayed
y
value is calculated from the
x
value; that is,
y
=
y
n
(x)
.
If the function is undefined at an
x
value, the
y
value is blank.
You can continue to trace a function that goes above or below the
viewing window. You cannot see the cursor as it moves in that
“off the screen” area, but the displayed coordinate values show its
correct coordinates.
Tracing a Function
To display the exact coordinates of any plotted point on a
graphed function, use the
…
Trace
tool. Unlike the free-
moving cursor, the trace cursor moves only along a function’s
plotted points.
Beginning a Trace
Note: If any stat plots are
graphed (Chapter 16), the
trace cursor appears on the
lowest-numbered stat plot.
Moving along a
Function
Note: If you enter an x
value, it must be between
xmin and xmax.
Tip: If your screen does not
show coordinates, set the
graph format so that
Coordinates =
RECT
or
POLAR
. Press:
TI
.
89:
¥
Í
TI
.
92 Plus:
¥
F
Tip: Use QuickCenter,
described on the next page,
to trace a function that goes
above or below the window.
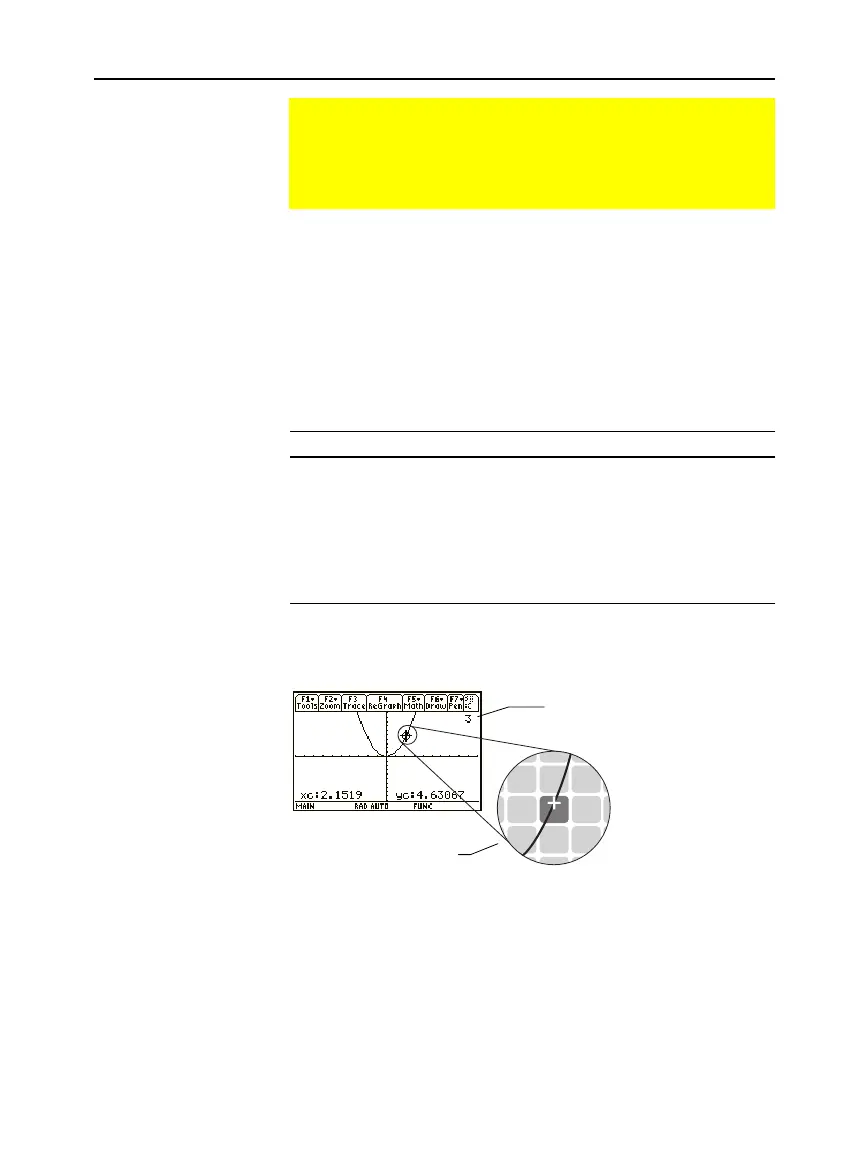
Trace coordinates are
those of the function, not
the pixel.
Function number being
traced. For example: y3(x).
 Loading...


