206 Chapter 12: Additional Graphing Topics
12ADDLGR.DOC TI-89/TI-92 Plus: Additional Graphing Tools (English) Susan Gullord Revised: 02/23/01 1:03 PM Printed: 02/23/01 2:15 PM Page 206 of 20
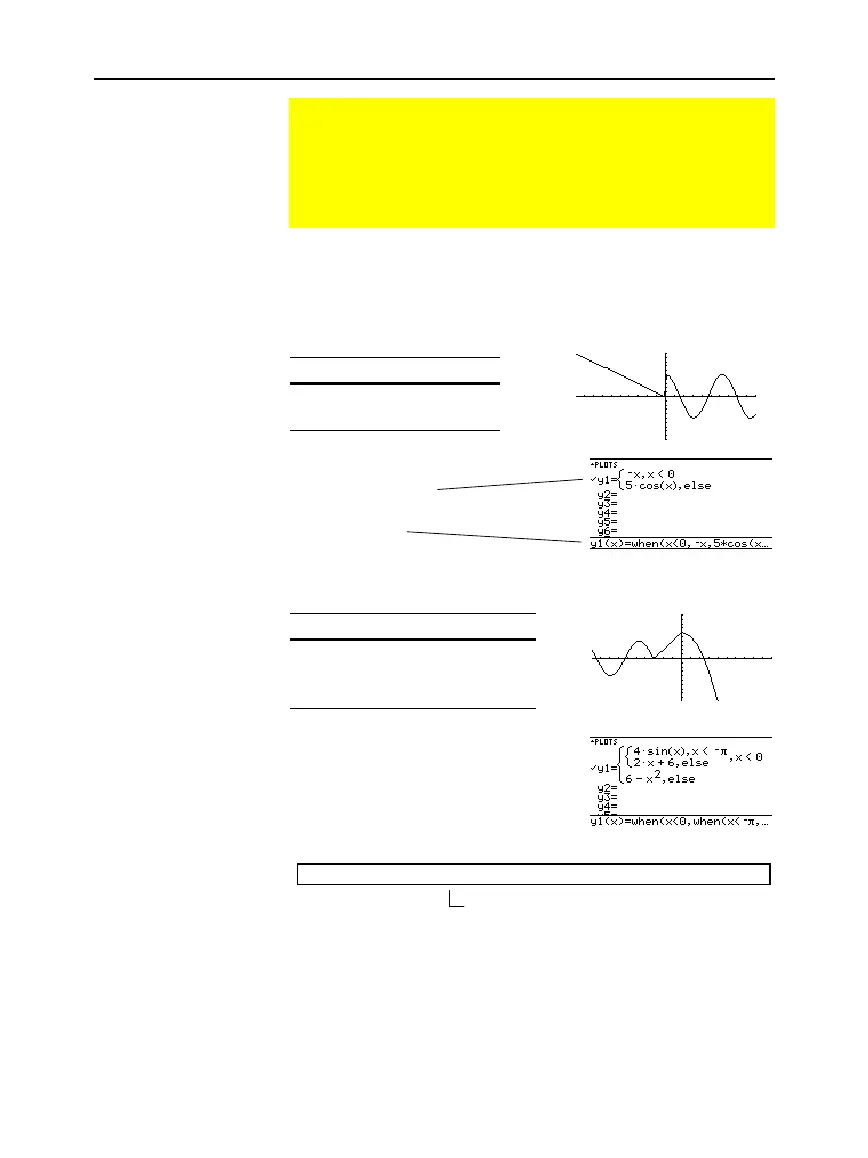
To define a two-piece function, use the syntax:
when
(condition, trueExpression, falseExpression)
For example, suppose you want to graph a function with two pieces.
When: Use expression:
x < 0
ë
x
x
‚
0 5 cos(x)
In the Y= Editor:
For three or more pieces, you can use nested
when
functions.
When: Use expression:
x <
ì
p
4 sin(x)
x
‚
ì
p
and
x < 0 2x + 6
x
‚
06
ì
x
ñ
In the Y= Editor:
where:
y1(x)=when(x<0,when(x<
ë
p,4
ù
sin(x),2x+6),6
ì
x^2)
Nested functions quickly become complex and difficult to visualize.
Graphing a Piecewise Defined Function
To graph a piecewise function, you must first define the
function by specifying boundaries and expressions for each
piece. The
when
function is extremely useful for two-piece
functions. For three or more pieces, it may be easier to create
a multi-statement, user-defined function.
Using the When
Function
Tip:
Graph math results
may vary.
Tip:
To enter
when
, type it
or use the CATALOG.
Enter the function
in this form.
The function is pretty
printed in this form.
This nested function is in effect when x<0.
 Loading...


