222 Chapter 13: Tables
13TABLES.DOC TI-89/TI-92 Plus: Tables (English) Susan Gullord Revised: 02/23/01 1:08 PM Printed: 02/23/01 2:16 PM Page 222 of 10
Steps
³
TI-89
Keystrokes
›
TI-92 Plus
Keystrokes Display
1. Display the
MODE
dialog box.
For the
Graph
mode, select
FUNCTION
.
3
B
1
¸
3
B
1
¸
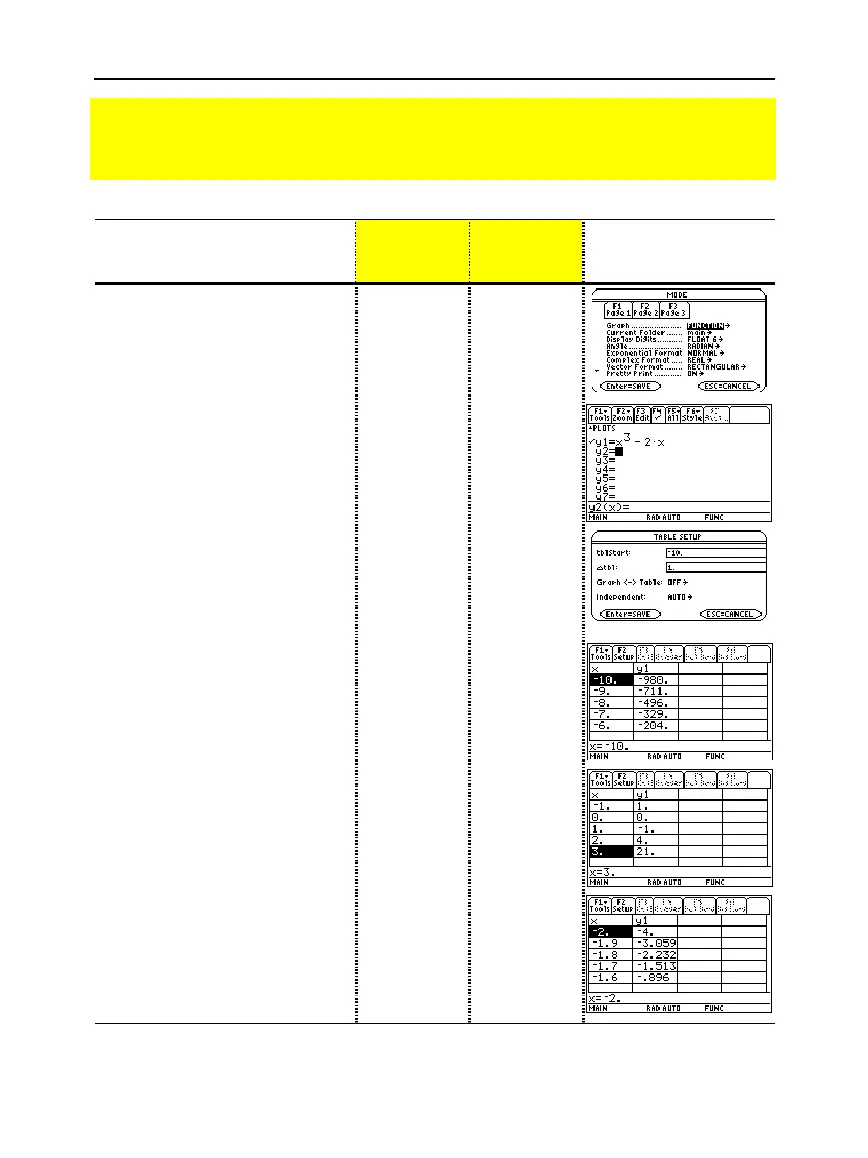
2. Display and clear the Y= Editor.
Then define
y1(x) = x
3
– 2x
.
¥#
ƒ
8
¸
¸
X
Z
3
|
2X
¸
¥#
ƒ
8
¸
¸
X
Z
3
|
2X
¸
3. Set the table parameters to:
tblStart
=
ë
10
@
tbl
=
1
Graph <
-
> Table
=
OFF
Independent
=
AUTO
¥&
·
10
D
1
DB
1
DB
1
¸
¥&
·
10
D
1
DB
1
DB
1
¸
4. Display the Table screen.
¥'
¥'
5. Scroll through the table. Notice
that
y1
changes sign at
x =
ë
1
,
1
,
and
2
.
To scroll one page at a time, use
2D
and
2C
.
D
and
C
as necessary
D
and
C
as necessary
6. Zoom in on the sign change
between
x =
ë
2
and
x =
ë
1
by
changing the table parameters
to:
tblStart
=
ë
2
@
tbl
= .
1
„
·
2
D
.1
¸¸
„
·
2
D
.1
¸¸
Preview of Tables
Evaluate the function y=x
3
ì
2x at each integer between
ë
10 and 10. How many sign
changes are there, and where do they occur?

 Loading...


