Chapter 10: 3D Graphing 153
10_3D.DOC TI-89/TI-92 Plus: 3D Graphing (English) Susan Gullord Revised: 02/23/01 11:00 AM Printed: 02/23/01 4:22 PM Page 153 of 22
Chapter 10:
3D Graphing
Preview of 3D Graphing ........................................................................ 154
Overview of Steps in Graphing 3D Equations .................................... 156
Differences in 3D and Function Graphing .......................................... 157
Moving the Cursor in 3D ....................................................................... 160
Rotating and/or Elevating the Viewing Angle..................................... 162
Animating a 3D Graph Interactively .................................................... 164
Changing the Axes and Style Formats................................................. 165
Contour Plots.......................................................................................... 167
Example: Contours of a Complex Modulus Surface ......................... 170
Implicit Plots........................................................................................... 171
Example: Implicit Plot of a More Complicated Equation ................. 173
This chapter describes how to graph 3D equations on the
TI
-
89 / TI
-
92 Plus
. Before using this
chapter, you should be familiar
with Chapter 6: Basic Function
Graphing.
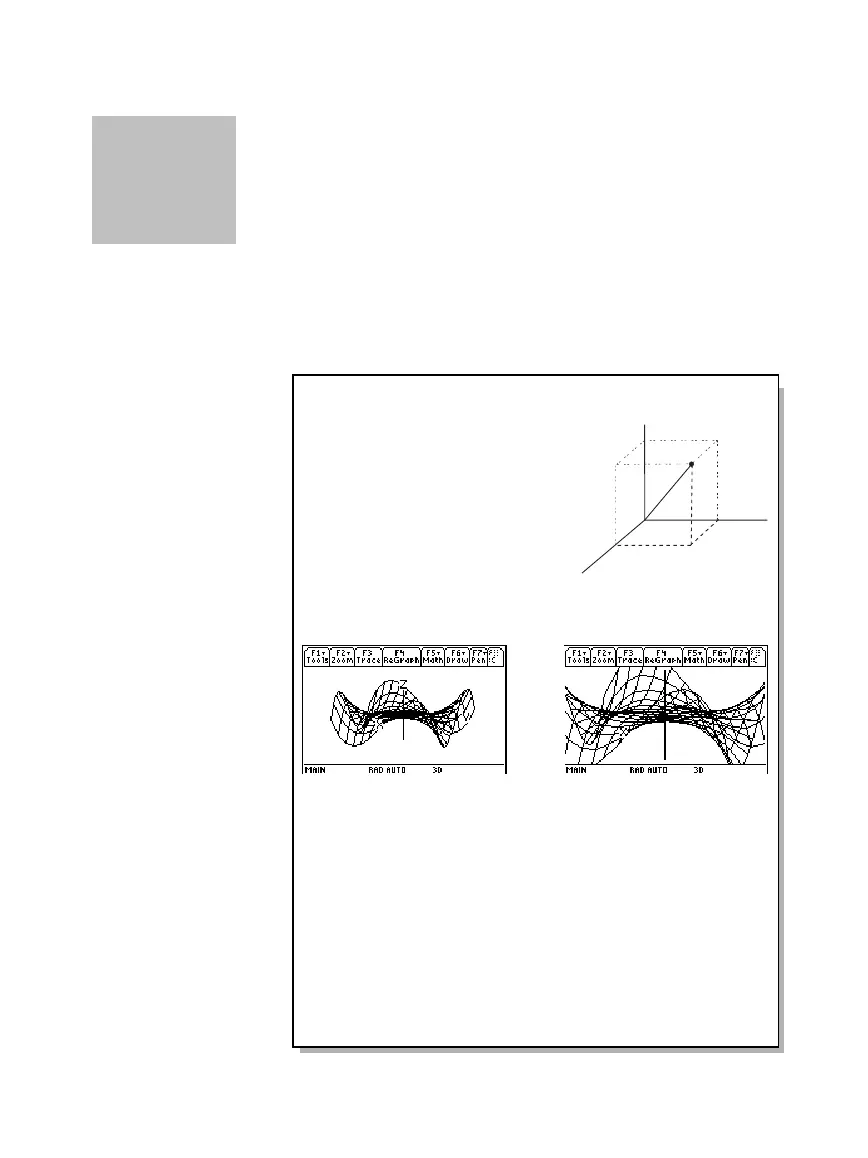
In a 3D graph of an equation for
z(x,y)
, a point’s location is defined
as shown here.
The expanded view feature lets
you examine any 3D graph in more detail. For example:
When you display a 3D graph, the expanded view is used
automatically if:
¦
You set or change the graph format style to
CONTOUR LEVELS
or
IMPLICIT PLOT
.
¦
The previous graph used the expanded view.
If you press a cursor key to animate the graph, the screen
switches to the normal view automatically. You cannot animate a
graph in the expanded view.
10
Tip: To view the graph
along the x, y, or z axis, you
can press
X
,
Y
, or
Z
,
respectively.
Tip: To switch from one
format style to the next
(skipping
IMPLICIT PLOT
),
press:
TI
-
89:
j
[F]
TI
-
92 Plus:
F.
This retains the current view
(either expanded or normal).
Note: To switch to
IMPLICIT
PLOT
(via the GRAPH
FORMATS dialog box),
press:
TI
-
89:
¥Í
TI
-
92 Plus:
¥
F.
To switch between normal and expanded views,
press
p
(multiplication key, not the letter X).
Normal view Expanded view

 Loading...


