134 Chapter 8: Polar Graphing
08POLAR.DOC TI-89/TI-92 Plus: Polar Graphing (English) Susan Gullord Revised: 02/23/01 10:57 AM Printed: 02/23/01 2:14 PM Page 134 of 6
Steps
³
TI-89
Keystrokes
›
TI-92 Plus
Keystrokes Display
1. Display the
MODE
dialog box.
For
Graph
mode, select
POLAR
.
For
Angle
mode, select
RADIAN
.
3
B
3
DDDB
1
¸
3
B
3
DDDB
1
¸
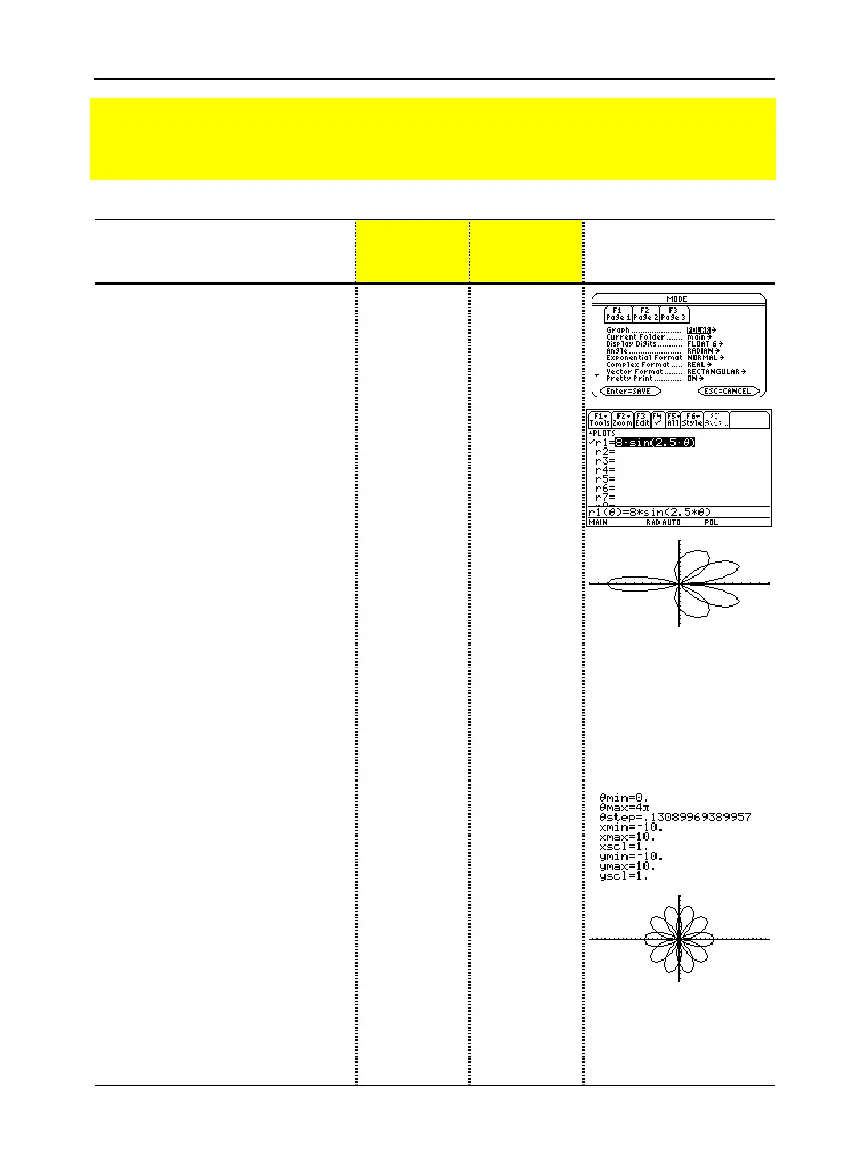
2. Display and clear the Y= Editor.
Then define the polar equation
r1(
q
) = A sin B
q
.
Enter 8 and 2.5 for A and B,
respectively.
¥#
ƒ
8
¸
¸
8
2W
2.5
¥Ïd¸
¥#
ƒ
8
¸
¸
8
W
2.5
Ï
d¸
3. Select the
ZoomStd
viewing
window, which graphs the
equation.
•
The graph shows only five rose
petals.
−
In the standard viewing window,
the Window variable
q
max = 2
p
.
The remaining petals have
q
values greater than 2
p
.
•
The rose does not appear
symmetrical.
−
Both the x and y axes range from
ì 10 to 10. However, this range is
spread over a longer distance
along the x axis than the y axis.
„
6
„
6
4. Display the Window Editor, and
change
q
max
to 4
p
.
4
p
will be evaluated to a number
when you leave the Window Editor.
¥$
D
4
2T
¥$
D
4
2T
5. Select
ZoomSqr
, which regraphs
the equation.
ZoomSqr increases the range along
the x axis so that the graph is shown
in correct proportion.
„
5
„
5
6. You can change values for
A
and
B
as necessary and regraph the
equation.
Preview of Polar Graphing
The graph of the polar equation A sin B
q
forms the shape of a rose. Graph the rose for
A=8 and B=2.5. Then explore the appearance of the rose for other values of A and B.

 Loading...


