Operating the XtraDrive Using XtraWare
4.9.10. Viewing the Data Graph
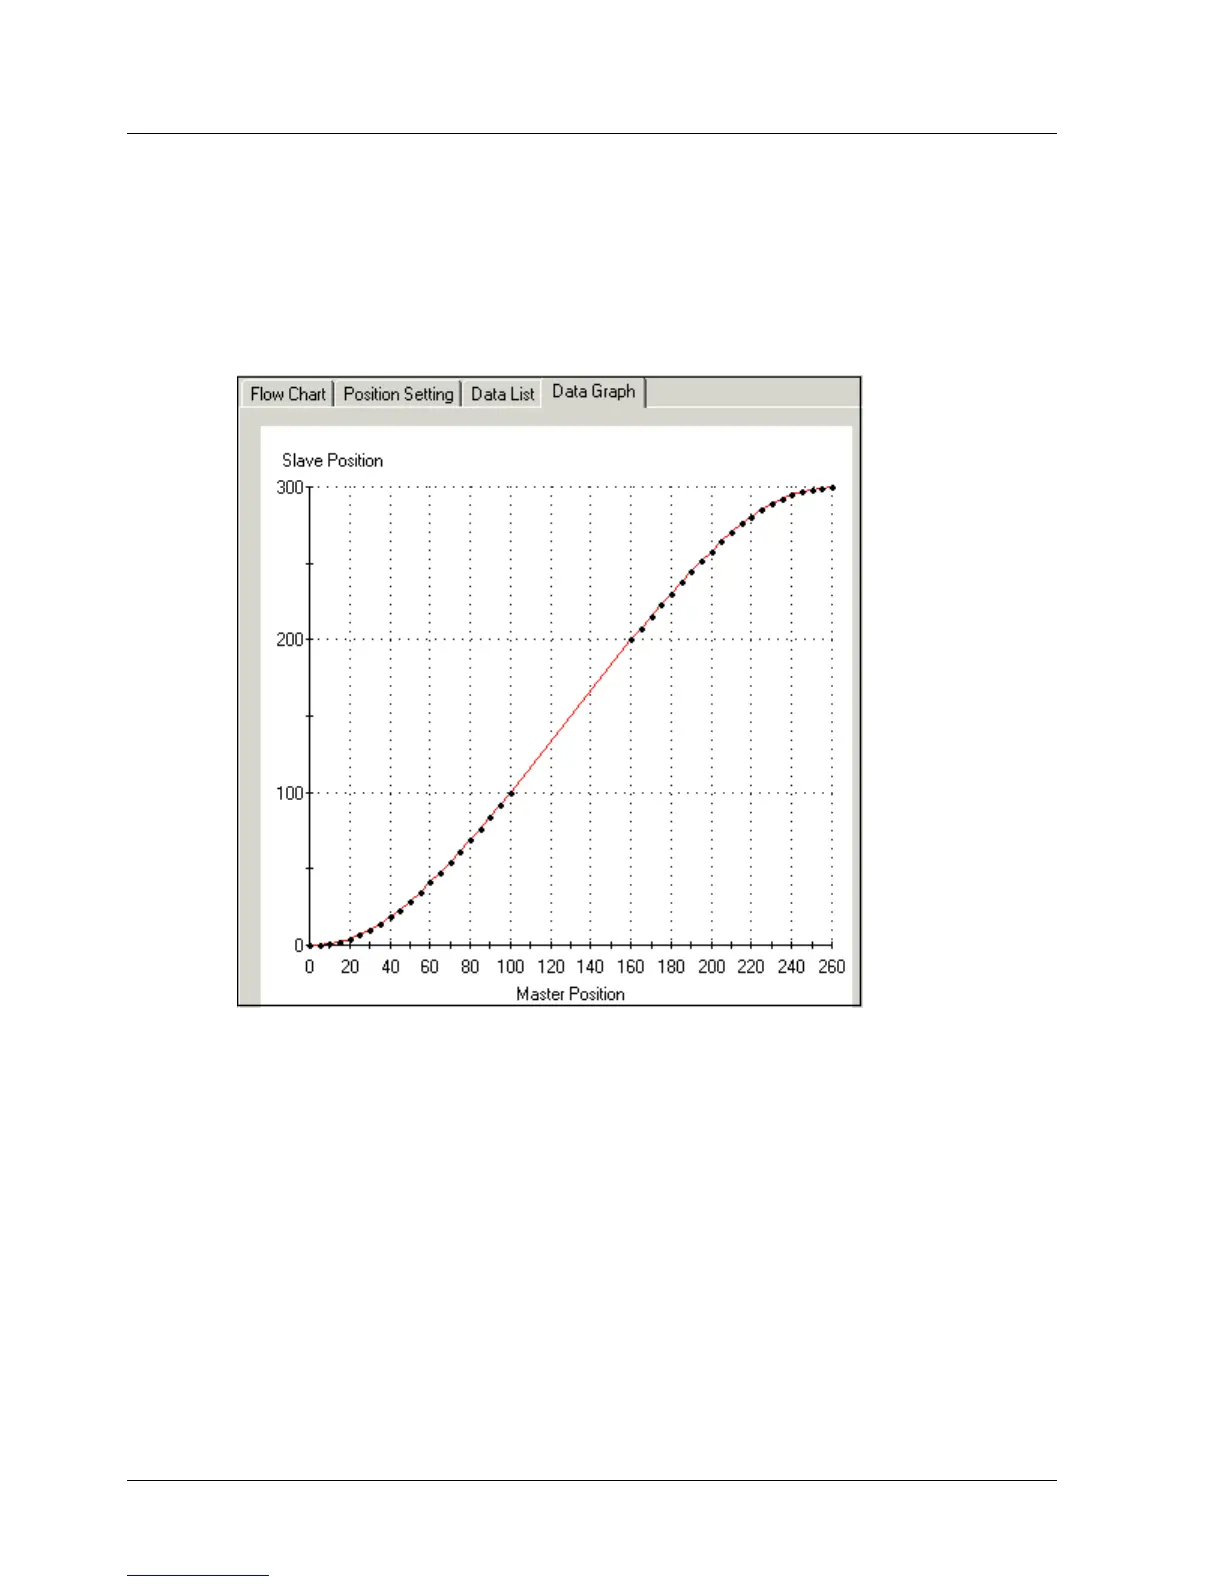
The data graph graphically represents the specified table. The dots along
the curve represent the interpolated points.
¾ To view the data graph:
1. Open the Data Graph tab.
The data graph is displayed.
Figure 41: Data Graph
4.9.11. Printing from the Electronic Cam Window
The contents of each of the Position Setting, Data List and Data Graph tabs
can be printed:
¾ To print from the Electronic Cam Window:
1. Select the profile to print from the Profile List.
2. Select the tab to be printed.
3. Click Print.
The Print dialog box is displayed.
60 XtraWare User Manual