12-10
IM DLM3054-01EN
Trend Display and Histogram Display (Trend/Histogram)
You can display up to two trends or histograms* of the specified measurement items. You can also display
values using the measurement feature. Mean, standard deviation, and other statistics can be displayed on the
histogram display.
* Only 1 on 2-channel models
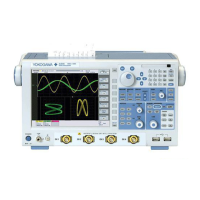
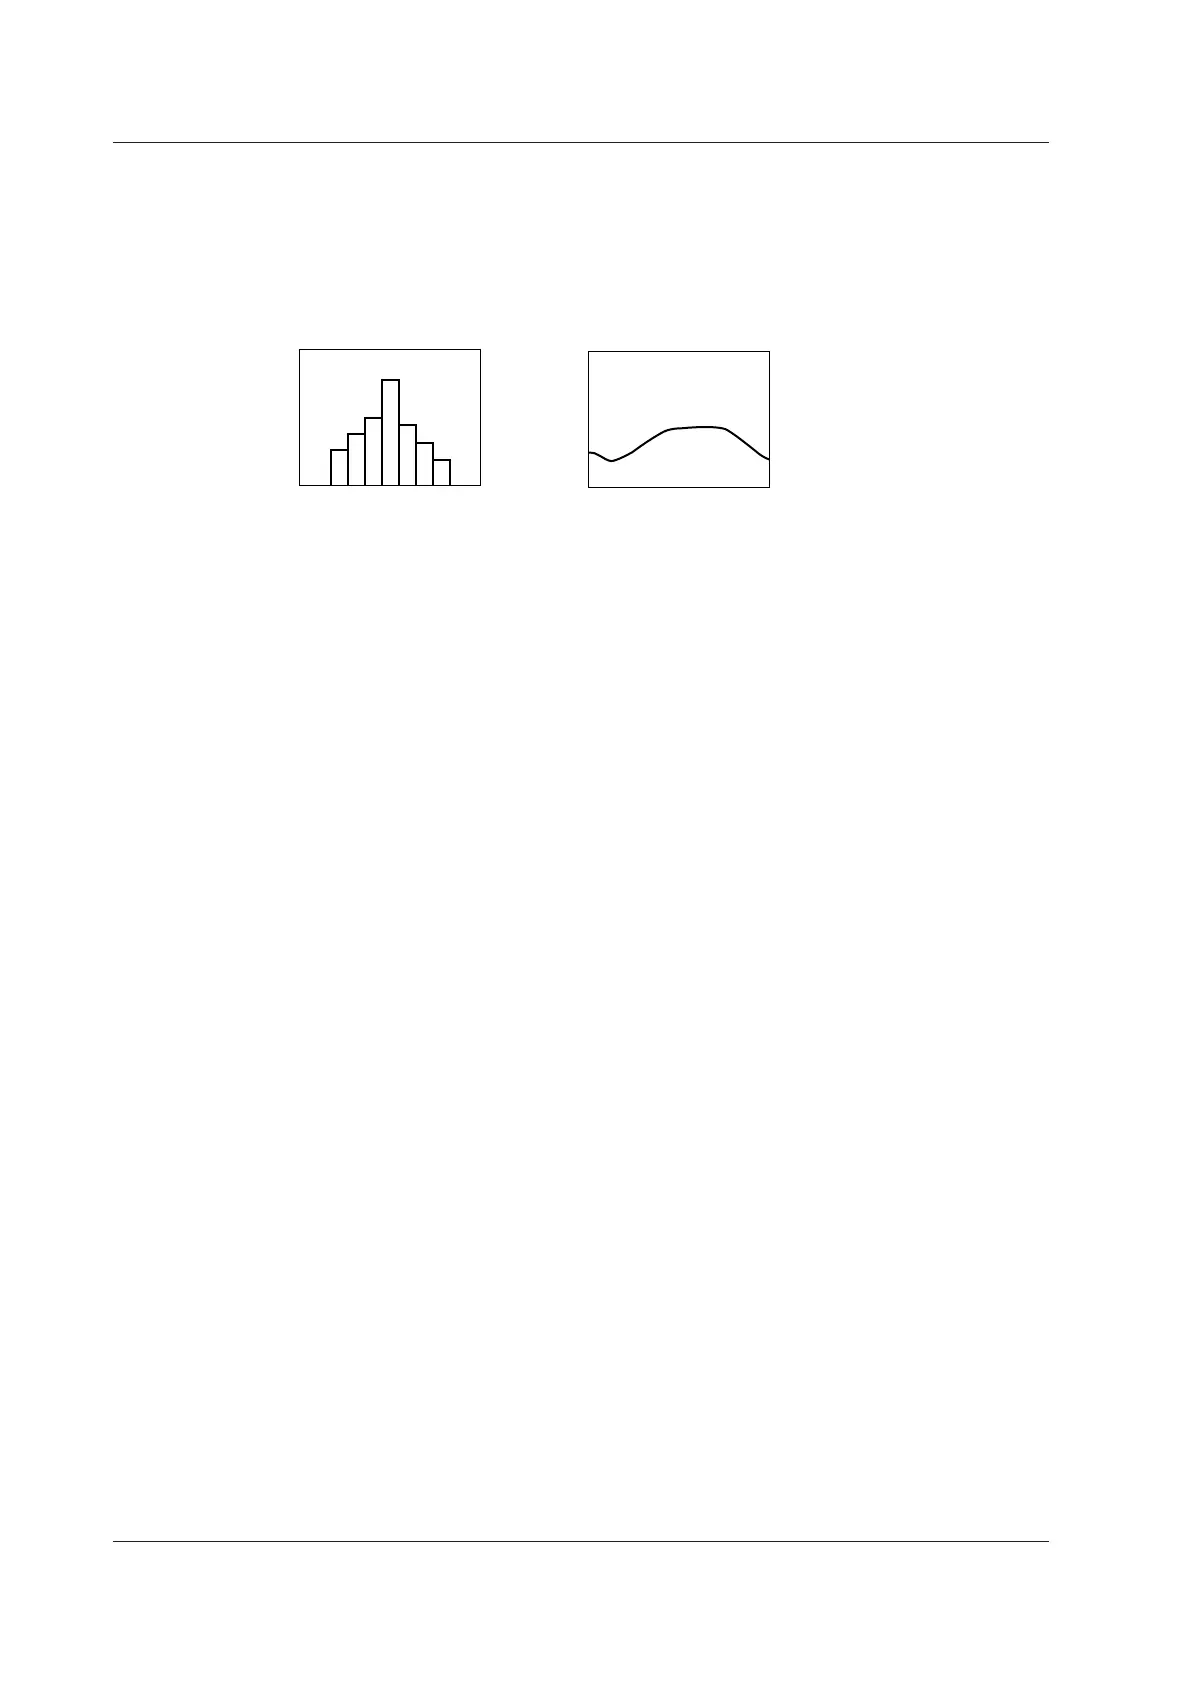
Display Example (Item = P-P)
→
P-P value
P-P value
→
Displaying Trends and Histograms (Display)
Set whether or not to display trends or histograms. If you select ON, you can set the type of graph to display and
the source. Trends and histograms are displayed in the Trend/Histogram window.
• Display
• OFF: Does not displays trends or histograms
• ON: Displays trends or histograms
• Type of Graph to Display (Mode)
You can set the type of graph you want to display to one of the settings below.
• Trend: Trend of the calculated statistics
• Histogram: Histogram of the calculated statistics
• Display Source (Item)
You can select the source waveform and the automatically measured item (you can only select one item) that
will be shown in the trend or histogram display.
The measurement items that are turned on in the Item Setup screen for the automated measurement of
waveform parameters appear in the list.
• Configuring the Display (Display Setup)
You can turn on and off the VT waveform display (shared with the trend and histogram display) and specify
how to set the display scale (trend display only).
• Auto Scale Exec
Executes auto scaling of the trend display Upper, Lower, and H-Span are set as follows:
Upper/Lower: Set so that the difference between the maximum and minimum values of the waveform
parameter is 80% of the waveform area.
H-Span: Set so that all of the waveform parameter values that were measured before Auto Scale was
executed are displayed.
• Upper/Lower
Set the vertical scale values of the trend display.
• H-Span
Set the horizontal scale values of the trend display. You can set this when the mode is set to Continuous or
History.
• H-Range
Select the window for setting the horizontal scale of the trend display. You can set this when the mode is
set to Cycle.
• VT Display
Set whether to display the VT waveform along with the trend or histogram display.
OFF: Does not display the VT waveform display window
ON: Displays the VT waveform display window
12 Automated Measurement of Waveform Parameters
 Loading...