QA (Quality Assurance)
191
Operation Manual
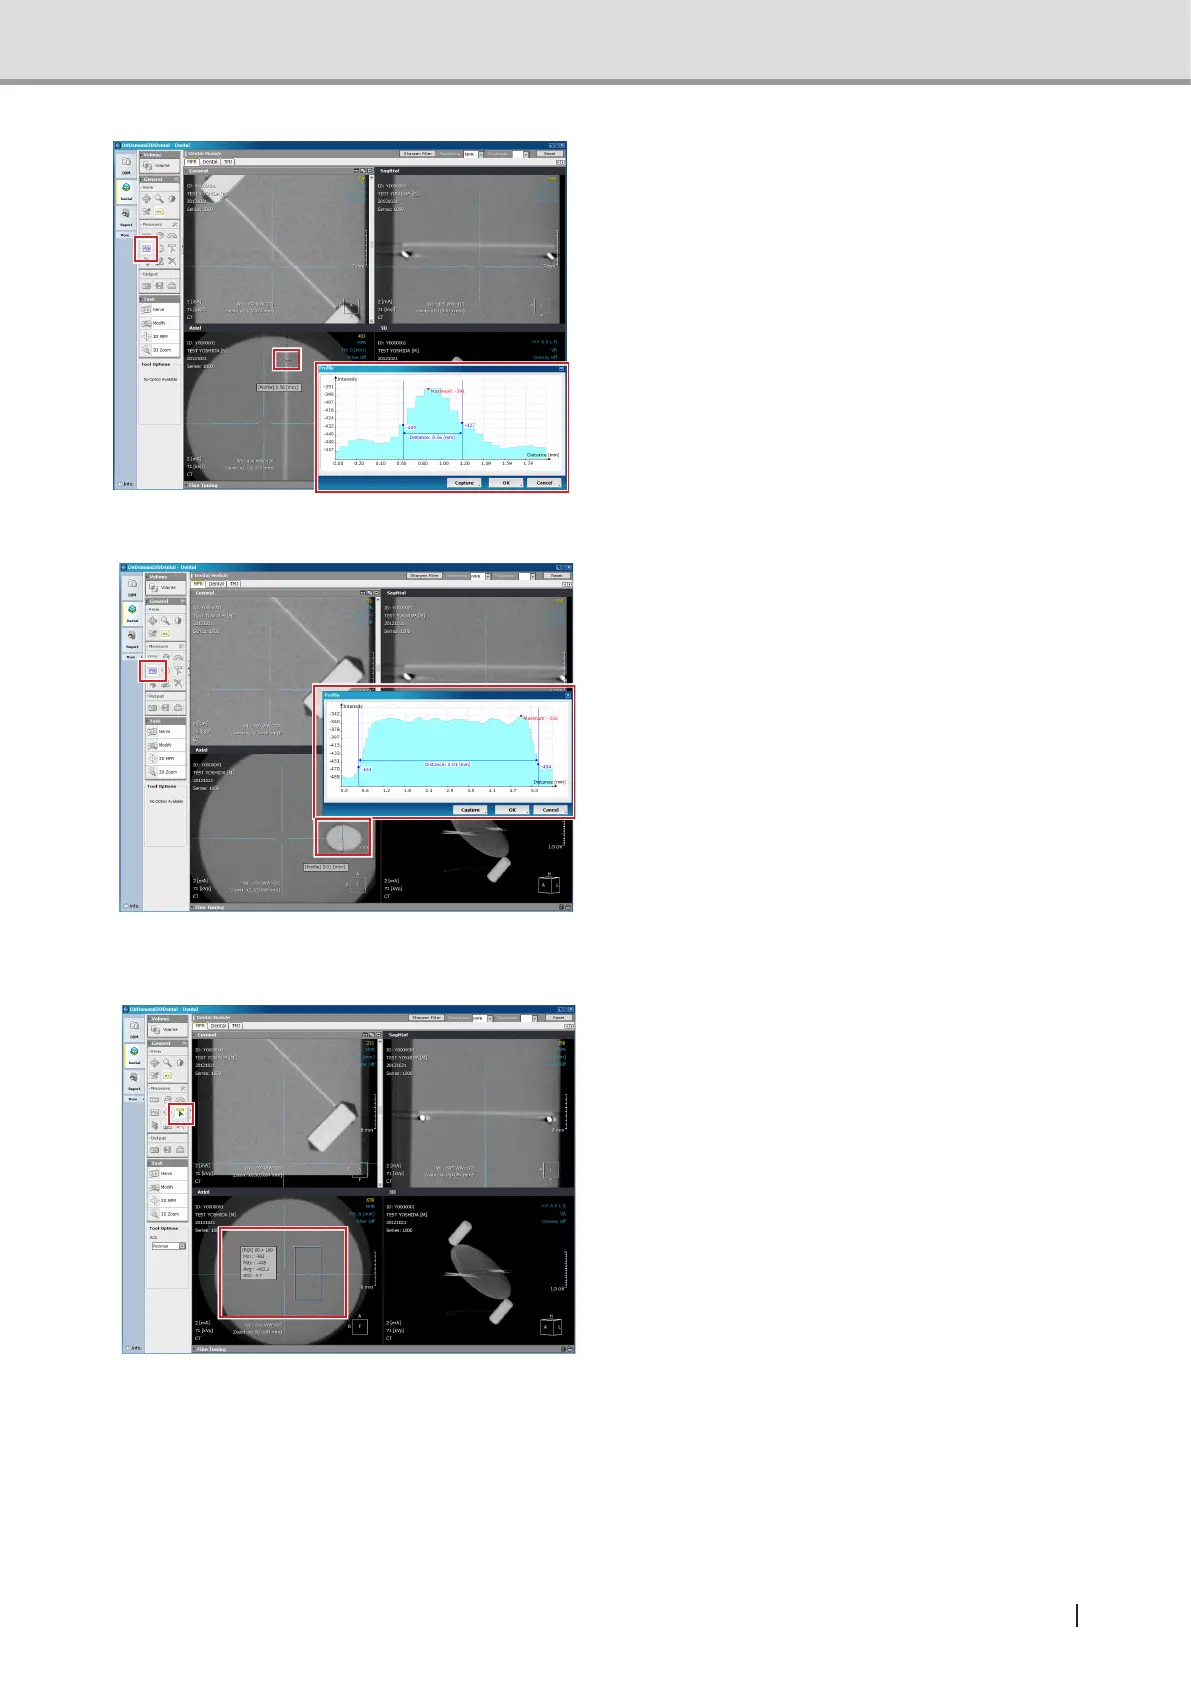
4 Measure aluminum disk thickness
from Axial image. However, measure it
without adjusting the crossbar tilt.
Where to measure is described in the
gurebelow.Measuringpointisabovethe
lowerTeonpinandbelowthealuminum
diskcenter.Usetheprolefunctiontoset
theprolesoitwillbeperpendiculartothe
Aluminum disk shown in the Axial image.
Measure the width of the graph when the
height of the graph is approximately 50%.
Acceptance value 0.7 mm or less
5 Measure the short axis diameter of the
TeonpinfromAxialimage.However,
measure it without adjusting the cross-
bar tilt.
Where to measure is described in the
gurebelow.Measuringpointisaround
thecenterofthelowerTeonpin.Usethe
prolefunctiontosettheproleoftheshort
axisdiameteroftheTeonpinshowninthe
Axial image. Measure the width between
the initial rising points in the graph.
Acceptance value 4.6mm to 5.3mm (stan-
dard value 5.0mm)
6 Find out the standard deviation of pixel
values of the acrylic part from the Axial
image. However, measure it without
adjusting the crossbar tilt.
Where to measure is described in the
gurebelow.Measuringpointisbetween
thebottomedgeoflowerTeonpinandthe
bottom edge of the image.Use ROI function
to read the Std value when acrylic part
shown in the Axial image is surrounded
by the size of 80 x 160. As shown in the
gurebelow,avoidthecenteroftheAxial
image when locating the surrounding area
with ROI.
Acceptance value:
ForImageCreatorVersion2.52orearlier:
10 or less
ForImageCreatorVersion2.53orlater:
120 or less