4.1.3 Change display range for Y axis
On the graph display, the range of the Y axis can be set at desired value.
As an example, following explanation for the procedure to change the range is made for the
logging panel.
(* with this example, the change is from 100 dB to 80 dB)
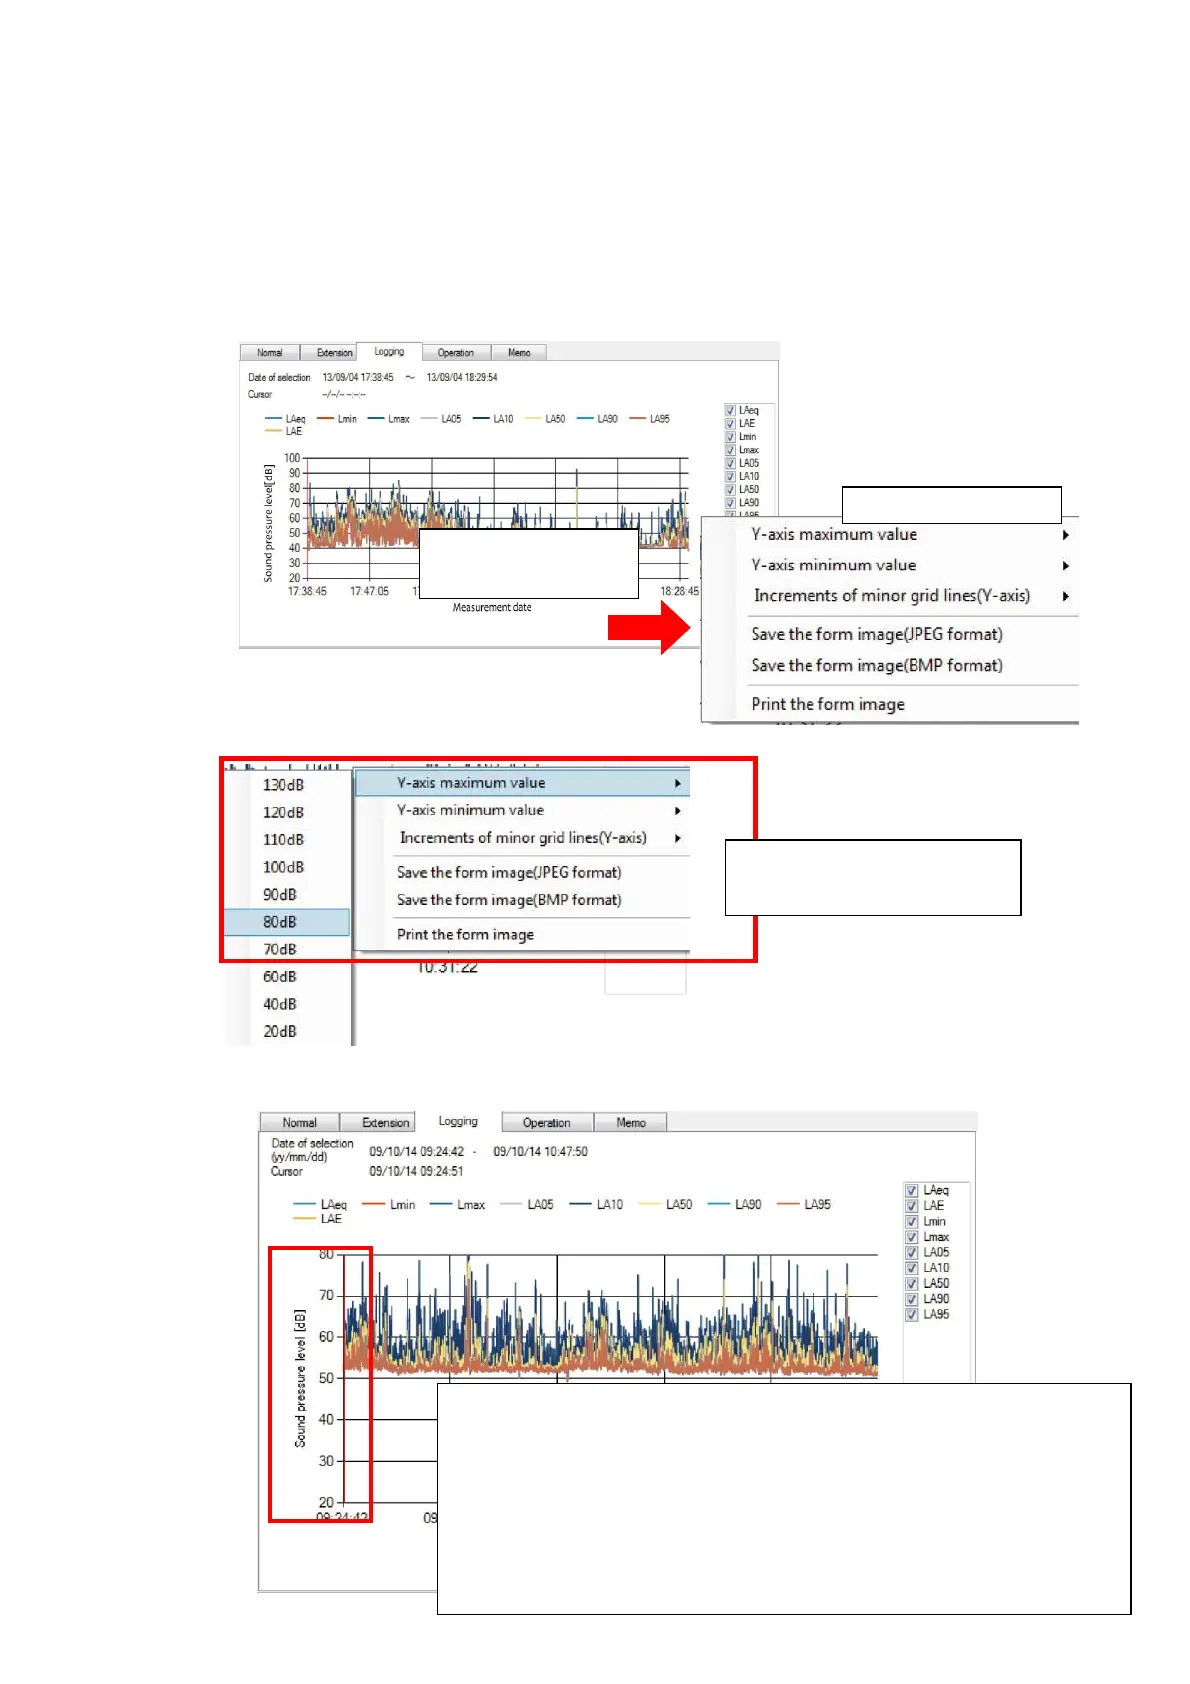
1. Right-click the mouse on the graph display screen. A shortcut menu will be displayed.
2. Select desired range from the menu.
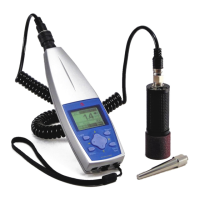
3. Y axis display range will be changed.
Select [Y axis maximum
value] and click [80 dB].
【Note】
Change of the range is only on the displayed graph and does
not affect the actual measured data. Therefore, once the
measurement data file is deleted from the measurement data
file list and then again the same measurement data file is
imported and the data is displayed, the range will be that of the
actual measured data.
Right-click on the
graph display
Shortcut menu