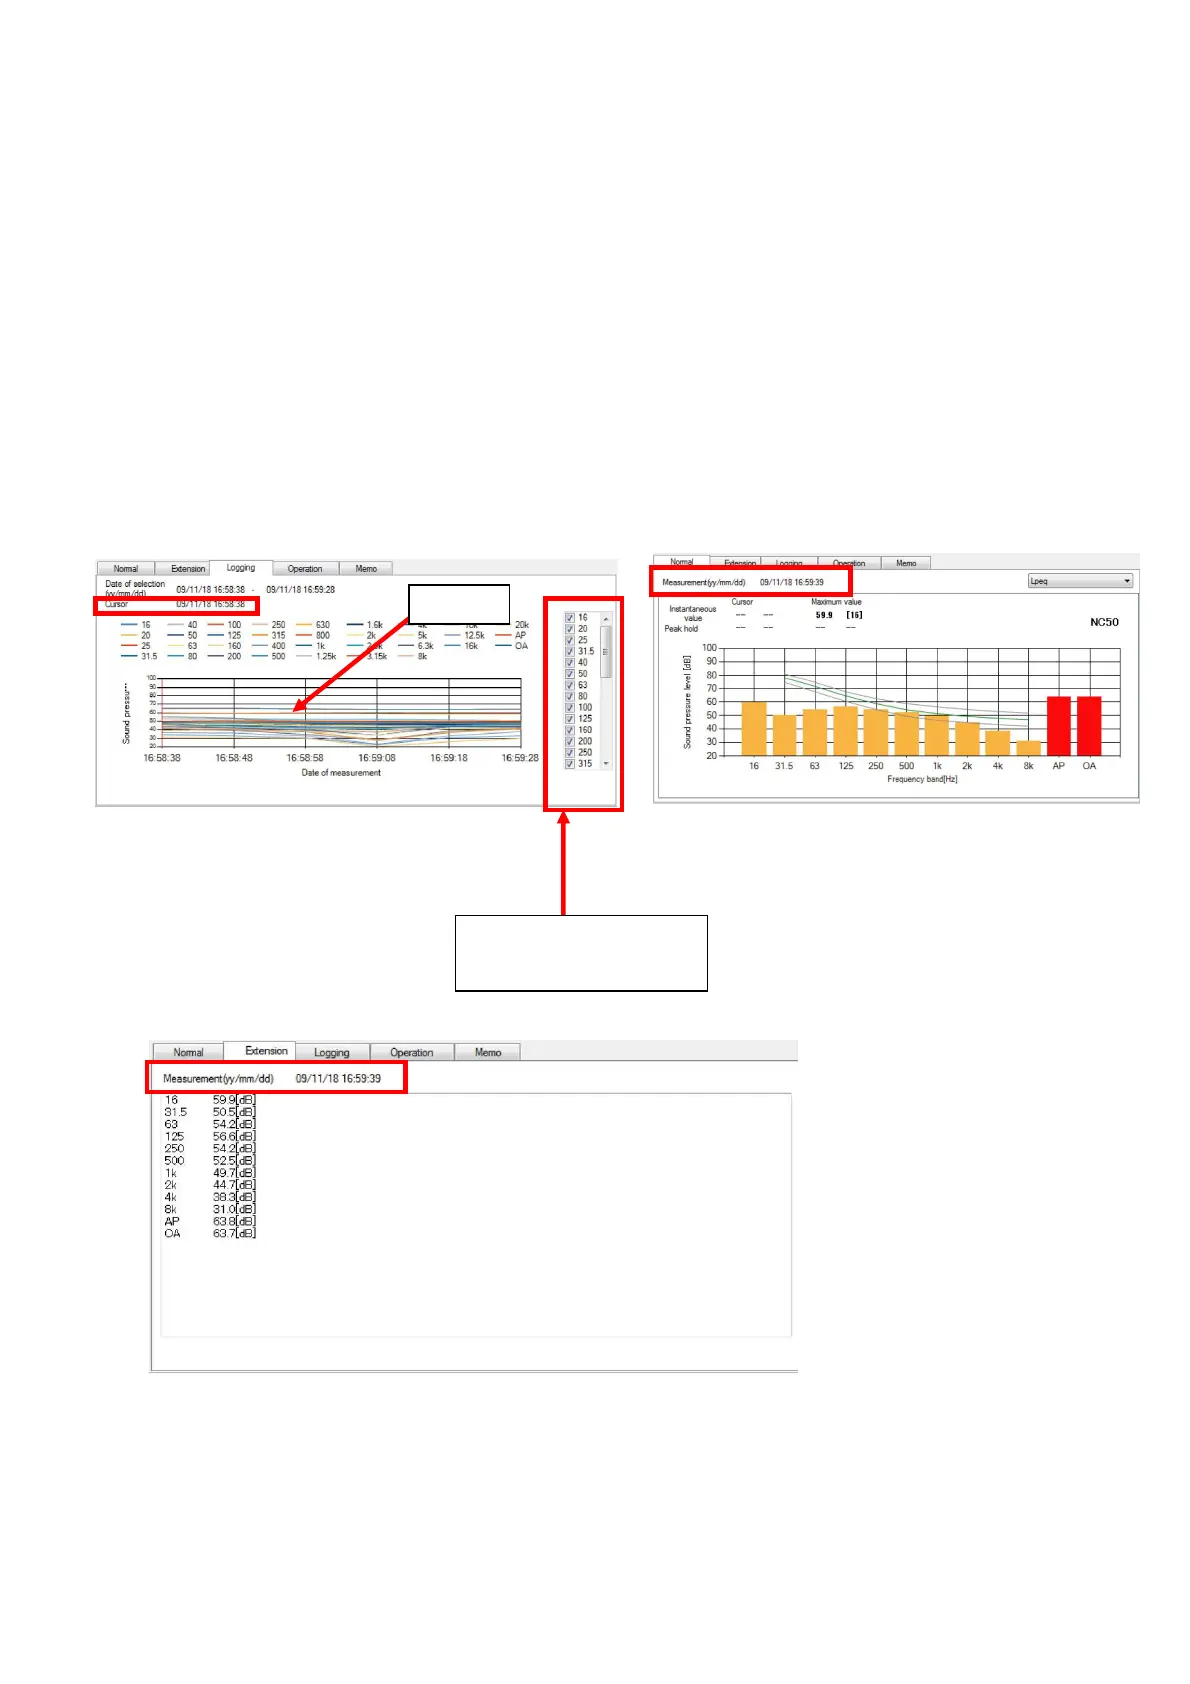
9.1.2 Display of logging
Select Logging panel to display measurement data in chronological order.
Logging is displayed if the measurement data has a measurement interval setting of [Repeat]
To designate frequency of each band for logging display, select desired frequencies using the check
box in the frequency list on right side of the display. Check mark in the box shows selected
frequencies. To clear the selection, click check marked box again and the check mark disappears.
If the graph is clicked at certain point by the mouse, such point (measurement date) becomes a
cursor and red line will move. Measurement date at the cursor will be displayed on the Normal
panel and Extension panel.
【1/1 Octave Real-time Analysis measurement data】
● Logging Panel ● Normal Panel
● Extension Panel
Click
Select desired
frequency to display