9.2 Display FFT Analysis measurement data
9.2.1 Display of measurement data
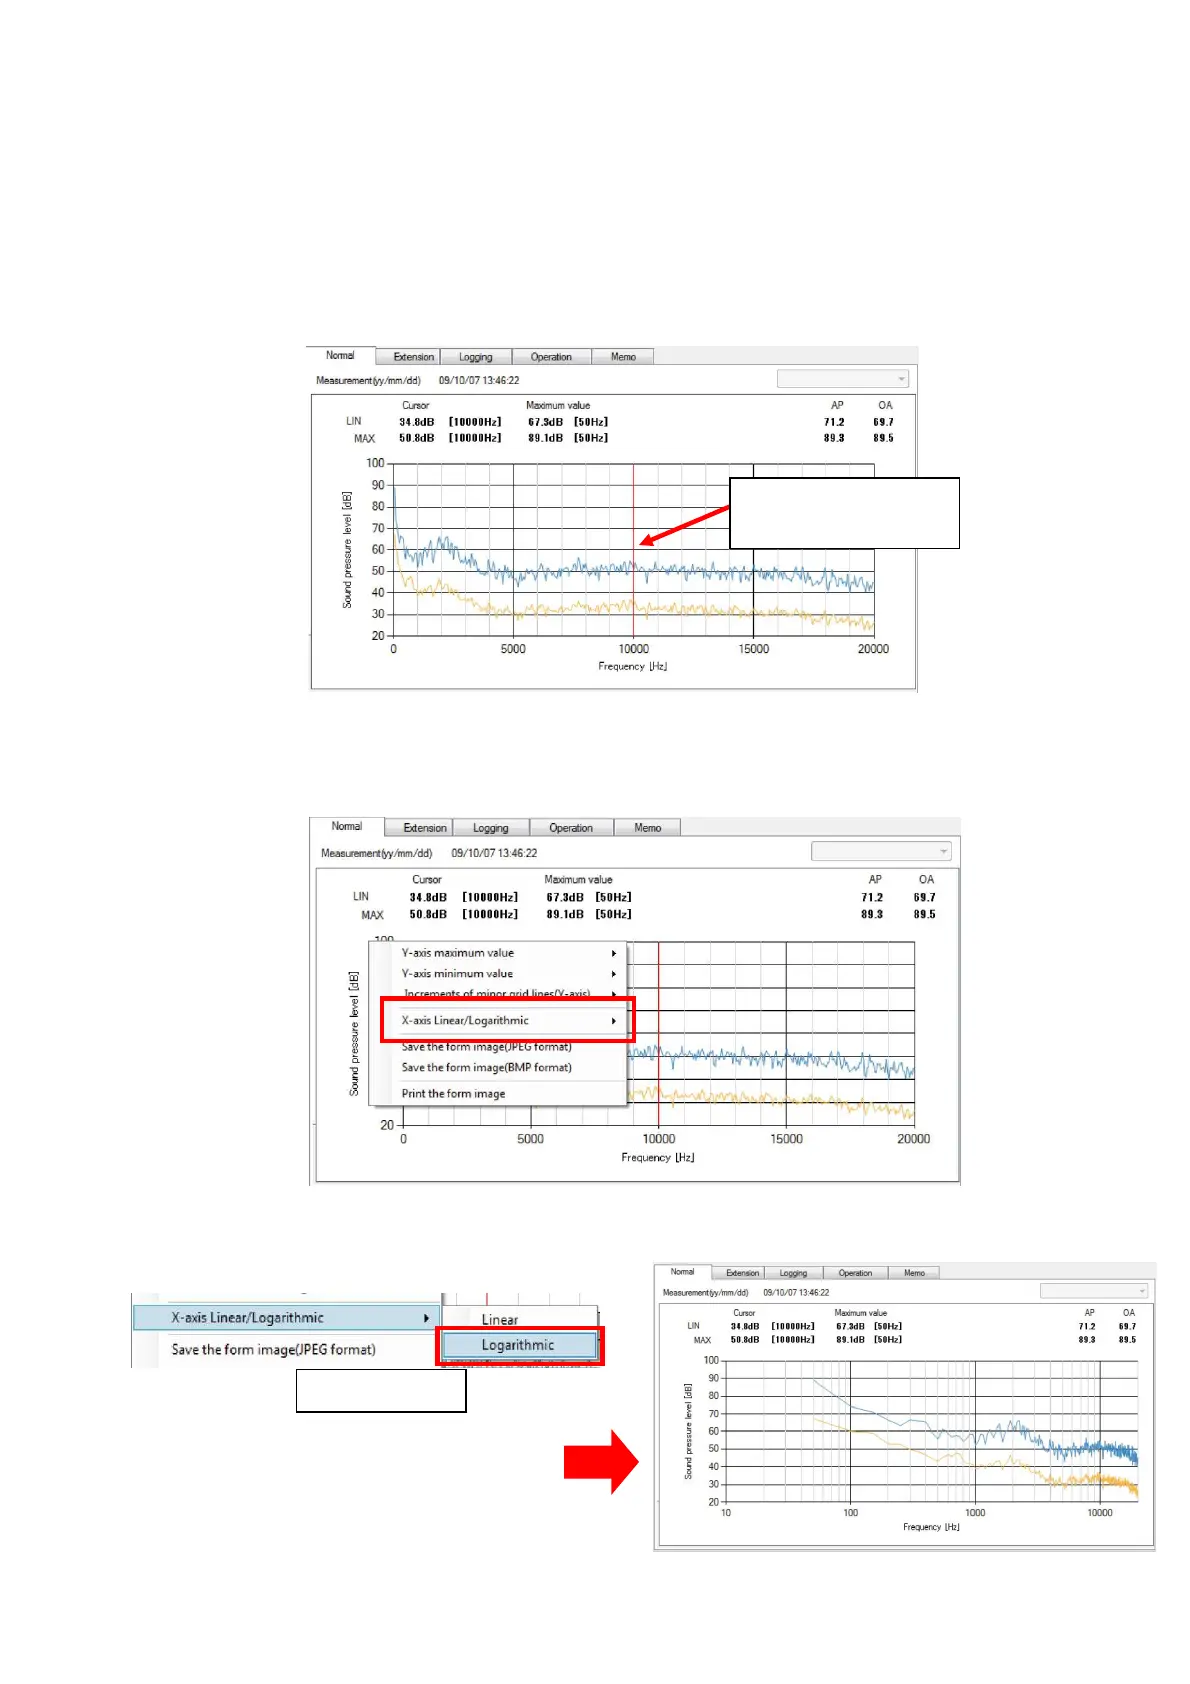
Display Normal Panel to see the measurement data.
For X axis, 【Liner】or 【Logarithm】 can be displayed. Default display is 【Liner】.
If the setting for the X axis is changed, such setting will be effective until the Data
Management Software is terminated.
If the graph is clicked at certain point by the mouse, such point (measurement date)
becomes a cursor and red line will move.
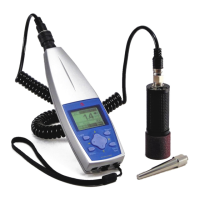
Procedure to change the setting for the X axis is as follows.
1. Right-click the mouse on the display of the Normal Panel. A menu for axis setting will
be displayed.
2. Select [X axis mode : linear/logarithm]→[Logarithmic axis] on the menu.
X axis display will become logarithmic.
Click to move the
red line.
Click